- CFA Exams
- 2026 Level I
- Topic 1. Quantitative Methods
- Learning Module 10. Simple Linear Regression
- Subject 3. Analysis of Variance
Why should I choose AnalystNotes?
Simply put: AnalystNotes offers the best value and the best product available to help you pass your exams.
Subject 3. Analysis of Variance PDF Download
Sum of Squares
The sum of squares total, denoted SST, is the squared differences between the observed dependent variable (Yi) and its mean (Y-bar). You can think of this as the dispersion of the observed variables around the mean - much like the variance in descriptive statistics.
The sum of squares regression, or SSR, is the sum of the differences between the predicted value (Y-hati) and the mean of the dependent variable.
It is the explained sum of squares, and tells you how much of the variation in the dependent variable your model explained.
The sum of squares error, or SSE, is the difference between the observed value and the predicted value. It measures dispersion of values around regression line, and is the unexplained variability by the regression.
- The smaller the SEE, the more accurate the regression line to predict the value of the dependent variable.
- It is very much like the standard deviation for a single variable, except that it measures the standard deviation of the residual term in the regression.
- If the actual values for the observations are close to the regression line, it means that the relationship between the dependent and independent variables are strong. However, it does not tell us how well the independent variable explains variation in the dependent variable.
Mathematically,
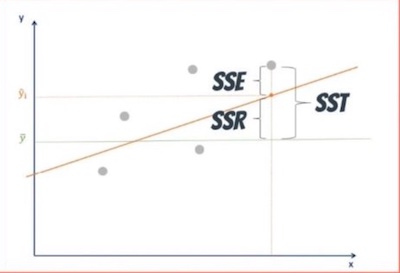
The total variability of the data set is equal to the variability explained by the regression line plus the unexplained variability, known as error.
Measures of Goodness of Fit
The coefficient of determination is a measure of the proportion of total variance in the dependent variable (Y) that can be explained by variation in the independent variable (X). It is a measure of the goodness of fit of the regression line.
The higher the R2, the better. R2 values range from 0 to 1.
The easiest way to calculate the coefficient of determination is to square the correlation coefficient, if that is known. Thus, the coefficient of determination is often denoted R2. This method, however, only works when there is just one independent variable. When there are two or more independent variables in linear regression, analysts need to use the formula R2 = SSR/SST. R2 is a ratio of the explained sum of squares to the total sum of squares.
One test statistic that is helpful in identifying significant variables is the F-statistic. The F-statistic can be a blunt tool in multiple regression, in that it tests the null hypothesis that all of the independent variables are equal to zero. That is, the hypotheses are structured as follows: H0: b1 = b2 = ... = bk = 0, and Ha: at least one bi <> 0. If the null is not rejected, all the slope coefficients are equal to 0, and therefore all slope coefficients are unimportant for predicting Y. You can see that F-test measures how well the regression equation explains the variation in the dependent variable. In simple linear regression, however, it simply tests whether the slope of the one independent variable is zero: H0: b1 = 0 vs. Ha: b1 ≠ 0.
To develop the F-test statistic, analysts need several items:
- The total number of observations, n.
- The number of parameters estimated (in simple linear regression, this is two: the intercept and the slope of the regression line).
- The sum of the squared errors (SSE), also known as the residual sum of the squares: SSE = ∑[Yi - Yi(hat)]2.
- The regression sum of the squares (RSS), which is the sum of the squared deviations of the regressed values of Y around the average value of Y: RSS = ∑[Yi(hat) - Y-bar]2.
The F-statistic for one independent variable will be:

Note that the F-statistic will have n-1 degree of freedom in the numerator (again, when there is only one independent variable) and n-2 degrees of freedom in the denominator.
A large test statistic (in absolute value) implies rejection of the null hypothesis and therefore a non-zero value for the slope of the regression line. A large F-statistic also implies that the regression model explains much of the variation in the dependent variable. However, for simple linear regression with one independent variable, F-statistics are rarely used, because they contain the same information as the t-statistic. In fact, the F-statistic is simply the square of the t-statistic in such regressions (note, this is not true for multiple regression).
Anova and Standard Error of Estimate in Simple Linear Regression
The analysis of variance (ANOVA) method can help in identifying which independent variables are of significant value to the regression model. Compared with the coefficient of determination, an ANOVA procedure provides more details about the sources of the variations.
Typically, the ANOVA procedure is performed using statistical software packages. The output of the ANOVA procedure is an ANOVA table.
Here is an example of an ANOVA table:
The formula for the standard error of estimate for a linear regression model with one independent variable is:
n - 2 is called the degrees of freedom: it is the denominator needed to ensure that the estimated standard error of estimate is unbiased.
Note that the errors are actually squared, averaged, and then the square root is taken. Consequently, large outliers will tend to have a greater impact on the value of the standard error than if a simple average was taken. Note too that the "averaging" is done by dividing by (n - 2). This is because the linear regression estimates two parameters, so divide by (n - 2) to make sure the calculated standard error of estimate is unbiased.
In finance world the standard error of estimate is also called unsystematic variation.
User Contributed Comments 6
| User | Comment |
|---|---|
| danlan2 | F=MSS/MSE=(RSS/k)/(SSE/(n-k-1)) |
| MasterD | "Mean Regression Sum Of Squares" is denoted MSR and equal to RSS/k. "Mean Squared Error" is denoted MSE and is equal to SSE/[n-(k+1)]. Thus F = MSR/MSE = {RSS/k}/{SSE/[n-(k+1)]} The confusing part is that the Anova Tables (ie pg 287) show these two MSR and MSE values under the "MSS" column title. It is read like this: The (Regression,MSS) is == MSR The (Residual,MSS) is == MSE |
| Oksanata | it seems like SSE here is identical to Unexplained Variation and RSS is identical to Explained Variation. |
| birdperson | @oksanata, agreed |
| dirdeb | To clarify, if we divide the Unexplained variation (SSE) by n-2 and then square rooted that total would that give us the Standard Error of Estimation (SEE) ? |
| davidt876 | @dirdeb - yes. |

You have a wonderful website and definitely should take some credit for your members' outstanding grades.

Colin Sampaleanu
My Own Flashcard
No flashcard found. Add a private flashcard for the subject.
Add