- CFA Exams
- 2026 Level I
- Topic 1. Quantitative Methods
- Learning Module 10. Simple Linear Regression
- Subject 2. Assumptions of the Simple Linear Regression Model
Seeing is believing!
Before you order, simply sign up for a free user account and in seconds you'll be experiencing the best in CFA exam preparation.
Subject 2. Assumptions of the Simple Linear Regression Model PDF Download
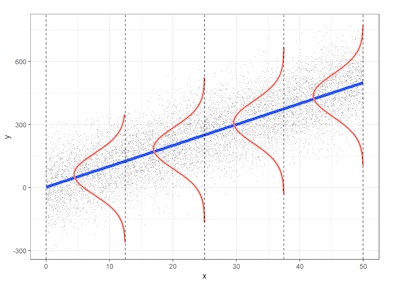
Classical normal linear regression assumptions (LINE):
- L (Linearity). A linear relation exists between Yi and Xi. This means the mean value for Y at each level of X falls on the regression line.
- I (Independence). The error terms ei are independent of the values of the independent variable X. That is, there's no connection between how far any two points lie from the regression line.
- N (Normality). For any value x, the error term has a normal distribution.
- E (Homoscedasticity). The variance of the error term (ei), denoted σ2, is the same for all x. That is, the spread in the Y's for each level of X is the same.
These assumptions are depicted in the following figure.
How do we check these assumptions? We examine the variability left over after we fit the regression line. We simply graph the residuals and look for any unusual patterns.
If a linear model makes sense, the residuals will:
- have a constant variance;
- be approximately normally distributed (with a mean of zero), and
- be independent of one another.
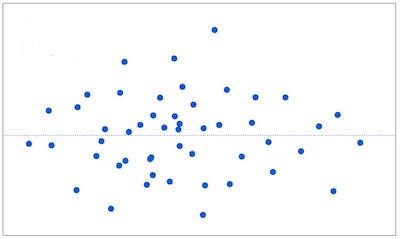
If the assumptions are met, the residuals will be randomly scattered around the center line of zero, with no obvious pattern. The residuals will look like an unstructured cloud of points, centered at zero.
If there is a non-random pattern, the nature of the pattern can pinpoint potential issues with the model.
For example, if curvature is present in the residuals, then it is likely that there is curvature in the relationship between the response and the predictor that is not explained by our model. A linear model does not adequately describe the relationship between the predictor and the response.
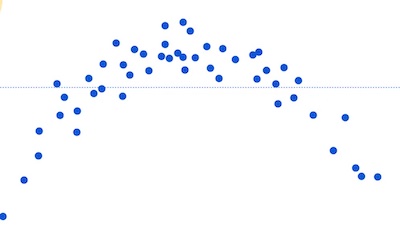
In this example, the linear model systematically over-predicts some values (the residuals are negative), and under-predict others (the residuals are positive).
Example
The yield of wheat per acre for the month of July is thought to be related to the rainfall. A researcher randomly selects acres of wheat and records the rainfall and bushels of wheat per acre.
- Dependent variable: Yield of wheat measured in bushels per acre for July.
- Independent variable: Rainfall measured in inches for July.
Analysis:
- L: The mean yield per acre is linearly related to rainfall.
- I: Field yields are independent; knowing one (X, Y) pair does not provide information about another.
- N: The yields for a given amount of rainfall are normally distributed.
- E: The standard deviation of yields is approximately the same for each rainfall level.
We may encounter problems with the linearity assumption if mean yields increase initially as the amount of rainfall increases after which excess rainfall begins to ruin crop yield. The random selection of fields should assure independence if fields are not close to one another.
Cross Sectional vs. Time-Series Regressions
Cross sectional datasets are those where we collect data on entities only once. For example we collect IQ and GPA information from the students at any one given time (think: camera snap shot).
Time-Series dataset is one where we collect information from the same entity (the same company, asset class, investment fund) over time (think: video).
In cross sectional datasets we do not need to worry about independence assumption. It is "assumed" to be met. - We worry about "independence" when we have a time-series dataset.
User Contributed Comments 0
You need to log in first to add your comment.

I am happy to say that I passed! Your study notes certainly helped prepare me for what was the most difficult exam I had ever taken.

Andrea Schildbach
My Own Flashcard
No flashcard found. Add a private flashcard for the subject.
Add