- CFA Exams
- 2026 Level I
- Topic 1. Quantitative Methods
- Learning Module 3. Statistical Measures of Asset Returns
- Subject 4. Correlation Between Two Variables
Why should I choose AnalystNotes?
Simply put: AnalystNotes offers the best value and the best product available to help you pass your exams.
Subject 4. Correlation Between Two Variables PDF Download
Scatter Plot
A scatter plot (aka scatter chart, scatter graph) uses dots to represent values for two different numeric variables. The position of each dot on the horizontal and vertical axis indicates values for an individual data point. Scatter plots are used to observe relationships between variables.
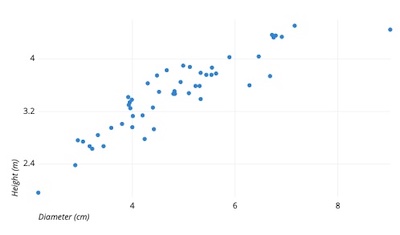
Relationships between variables can be described in many ways: positive or negative, strong or weak, linear or nonlinear.
Scatter plots are a powerful tool for finding patterns between two variables, for assessing data range, and for spotting extreme values.
Through the use of a "Line of Best Fit" or a trend line, scatter plots to help identify trends.
Two common issues have been identified with the use of scatter plots - over-plotting and the interpretation of causation as correlation.
Over-plotting occurs when there are too many data points to plot, which results in the overlapping of different data points. It can make relationship identification between variables challenging.
Covariance and Correlation
Concerning correlation, it is important to remember that correlation does not mean that the changes observed in one variable are responsible for the changes observed in another variable. Correlation should not be interpreted as causation. Causation implies that an event occurring will have an impact on an outcome.
Variance and standard deviation measure the dispersion of a single random variable. Often times, we want to know the relationship between two variables. For example, what is the relationship between the performance of the S&P 500 and that of U.S. long-term corporate bonds? We can use covariance and correlation to measure the degree to which two random variables are related to each other.
Given two random variables, Ri and Rj, the covariance between the two variables is:
Facts about covariance:
- Covariance of returns is negative if, when the return on one asset is above its expected value, the return on the other asset is below its expected value (an average inverse relationship between returns).
- Covariance of returns is 0 if returns on the assets are unrelated.
- Covariance of returns is positive if, when the return on one asset is above its expected value, the return on the other asset is above its expected value (an average positive relationship between returns).
- The covariance of a random variable with itself (own covariance) is its own variance.
Example
Suppose that the future short-term outlook for the economy is favorable with a probability 0.6 and unfavorable with a probability of 0.4. For two stocks, F and G, returns are 0.25 and 0.2, respectively, in favorable conditions, and 0.01 and 0.02, in unfavorable conditions. Calculate cov (Rf, Rg).
We must firstly calculate the expected value of the return on each stock:
E[Rf] = 0.6 x 0.25 + 0.4 x 0.01 = 0.154
E[Rg] = 0.6 x 0.2 + 0.4 x 0.02 = 0.128
cov (Rf, Rg) = E[{Rf - E(Rf)} x {Rg - E(Rg)}] = 0.6 x [{0.25 - 0.154}x {0.2 - 0.128}] + 0.4 x [{0.01 - 0.154}x {0.02-0.128}] = 0.010368
The fact that the answer is positive indicates that the return on both stocks is above (or below) the expected value at the same time. We know that this is the case because both returns are higher in favorable conditions and lower in unfavorable conditions. Had we obtained a negative answer, logic would have told us that we had made an error somewhere.
The correlation between two random variables, Ri and Rj, is defined as:
Alternative notations are corr(Ri, Rj) and ρij.
Properties of correlation:
- Correlation is a number between -1 and +1.
- A correlation of 0 indicates an absence of any linear (straight-line) relationship between the variables.
- Increasingly positive correlation indicates an increasingly strong positive linear relationship (up to 1, which indicates a perfect linear relationship).
- Increasingly negative correlation indicates an increasingly strong negative linear relationship (down to -1, which indicates a perfect inverse linear relationship).
The correlation between two variables represents the degree to which these variables are related. It is important to keep in mind that correlation does not necessarily mean causation. For example, there is a high positive relationship between the number of fire-fighters sent to a fire and the amount of damage done. Does this mean that the fire fighters cause the damage? Or is it more likely that the bigger the fire, the more fire fighters are sent and the more damage is done? In this example, the variable "size of the fire" is the causal variable, correlating with both the number of fire-fighters sent and the amount of damage done.
The relationship among covariance, standard deviation, and correlation:
Using the figures from the previous example, we first need to calculate the two standard deviation terms:
Var(Rf) =[{Rf - E(Rf)}2] x P(Rf) = 0.6 x [{0.25-0.154}2] + 0.4 x [{0.01-0.154}2] = 0.013824. Hence, σ(Rf) = 0.117576
Var(Rg) = [{Rg - E(Rg)}2] x P(Rg) = 0.6 x [{0.2-0.128}2] + 0.4 x [{0.02-0.128}2] = 0.007776. Hence, σ(Rg) = 0.088182
Also, we know that cov(Rf,Rg) = 0.010368.
So, correlation = ρ(Rf, Rg)= cov(Rf, Rg) / σ(Rf) x σ(Rg) = 0.010368 / (0.117576 x 0.088182) = 0.99999.
This indicates an almost perfect positive linear relationship between Rf and Rg.
Calculate covariance given a joint probability function:
We can calculate covariance using the joint probability function of the random variables if that can be estimated. The joint probability function of two random variables, X and Y, denoted P(X, Y), gives the probability of joint occurrences of values X and Y. For example, P(3, 2) is the probability that X equals 3 and Y equals 2.
User Contributed Comments 0
You need to log in first to add your comment.

Your review questions and global ranking system were so helpful.

Lina
My Own Flashcard
No flashcard found. Add a private flashcard for the subject.
Add