Seeing is believing!
Before you order, simply sign up for a free user account and in seconds you'll be experiencing the best in CFA exam preparation.
Subject 1. Data Types
Data can be defined as a collection of numbers, characters, words, text, images, audio and video in a raw or organized format to represent facts or information.
Numerical versus Categorical Data
From a statistical perspective, data can be classified as numerical data and categorical data.
Numerical data are values to represent measured or counted quantities as a number. They can be further split into two types:
- Continuous data can be measured and take on any numerical value in a specified range of values. There are normally lots of decimal places involved and (theoretically, at least) there are no gaps between permissible values (i.e., all values can be included in the data set).
Examples would include the height of a person and the time to complete an assignment. These values can be measured using sufficiently accurate tools to numerous decimal places. - Discrete data result from a counting process and therefore are limited to a finite number of values. That is, the values in the data set can be counted. There are distinct spaces between the values, such as the number of children in a family or the number of shares comprising an index.
Categorical data are values that describe a quality or characteristic of a group of observations and usually take only a limited number of values that are mutually exclusive. They can be further classified into nominal data and ordinal data.
Nominal data are not amenable to being organized in a logical order.
- Nominal measurement represents the weakest level of measurement.
- It consists of assigning items to groups or categories.
- No quantitative information is conveyed and no ordering (ranking) of the items is implied.
- Nominal scales are qualitative rather than quantitative.
Religious preference, race, and sex are all examples of nominal scales. Another example is portfolio managers categorized as value or growth style will have a scale of 1 for value and 2 for growth. Frequency distributions are usually used to analyze data measured on a nominal scale. The main statistic computed is the mode. Variables measured on a nominal scale are often referred to as categorical or qualitative variables.
Ordinal data are categorical values that can be logically ordered and ranked.
- Measurements on an ordinal scale are categorized.
- The various measurements are then ranked in their categories.
- Measurements with ordinal scales are ordered with higher numbers representing higher values. The intervals between the numbers are not necessarily equal.
Example 1
On a 5-point rating scale measuring attitudes toward gun control, the difference between a rating of 2 and a rating of 3 may not represent the same difference as that between a rating of 4 and a rating of 5.
Example 2
Two categories might be value and growth. Within each category, the portfolio managers measured will be weighted according to performance on a scale from 1 to 10, with 1 being the best- and 10 the worst-performing manager.
There is no "true" zero point for ordinal scales, since the zero point is chosen arbitrarily. The lowest point on the rating scale in the example was arbitrarily chosen to be 1. It could just as well have been 0 or -5.
Cross-Sectional versus Time-Series versus Panel Data
Based on how they are collected, data can be categorized into three types.
Time-series data is a set of observations for a single observational unit collected at usually discrete and equally spaced time intervals. Examples: the daily closing price of a certain stock recorded over the last six weeks, weekly sales figures of ice cream sold during a holiday period at a seaside resort.
Cross-sectional data are observations that come from different observational units at a single point in time. The underlying population should consist of members with similar characteristics. For example, suppose you are interested in how much companies spend on research and development expenses. Firms in some industries, such as retail, spend little on research and development (R&D), while firms in industries such as technology spend heavily on R&D. Therefore, it's inappropriate to summarize R&D data across all companies. Rather, analysts should summarize R&D data by industry and then analyze the data in each industry group.
Panel data is a mix of time-series and cross-sectional data that consists of observations through time on one or more variables for multiple observation units.
Structured versus Unstructured Data
Based on whether or not data are in a highly organized form, they can be classified into structured and unstructured types.
Structured data are highly organized in a pre-defined manner, usually with repeating patterns. Market data, fundamental data and analytical data are typical examples.
Unstructured data do not follow any conventionally organized forms. Common types are text, audio, video. They are typically alternative data as they are usually collected from unconventional sources such as individuals, business processes and sensors.
Typically, unstructured data must first be transformed into structured data that financial models can process.
Practice Question 1
Consider the following time plot of the price of a commodity (in dollars) for each month of a 60-month period.
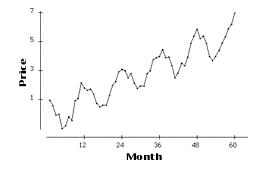
Which of the following is (are) true about the time plot?
I. The increase in the price of the commodity from month 1 to month 60 is $7.
II. The time plot displays a trend.Correct Answer: II only
The price of the commodity in month 1 is approximately $1 and the price of the commodity at month 60 is approximately $7. This corresponds to an increase of $6. If you thought statement I was correct, you were only looking at the price at month 60, not at the change in price.
Practice Question 2
Stock performance can be rated as 5 (superior), 4 (above average), 3 (average), 2 (below average) or 1 (poor). This is an example of which type of measurement?A. nominal
B. ordinal
C. intervalCorrect Answer: B
This is an example of an ordinal scale. since this data can be ranked or ordered but the difference between the ranks cannot be determined in a meaningful way.
Practice Question 3
If you listed your religious preference on a questionnaire, this would be what level of data?A. nominal
B. ordinal
C. intervalCorrect Answer: A
Practice Question 4
Rating a presentation as poor, fair, good, or excellent would be what level of measurement?A. nominal
B. ordinal
C. intervalCorrect Answer: B
Practice Question 5
Data is a collection of:
I. wordsII. text
III. video
IV. imagesCorrect Answer: I, II, III and IV.
Practice Question 6
Which of the following is most likely to be unstructured data?
A. The text in a social media post.B. Daily trading volumes of 8 major stock exchanges worldwide.
C. EPS for a given year for all Fortune 500 companies.Correct Answer: A
The text in a social media post is unstructured data, while information about friendships, followers, groups or networks is structured.
Examples of unstructured data are: document collections such as invoices, emails, sensor data, audio etc.
Practice Question 7
If you listed your college major, what level of measurement would this be?A. nominal
B. ordinal
C. ratioCorrect Answer: A
Practice Question 8
When a newspaper lists the rankings of college football teams, these rankings are what level of measurement?A. nominal
B. ordinal
C. ratioCorrect Answer: B
Practice Question 9
August unemployment rates for each of the U.S. states in 2020 is considered to be cross-sectional data. "August unemployment rates" is known as the ______.A. variable
B. observation
C. observational unitCorrect Answer: A
A variable can be measured and is subject to change.
Practice Question 10
Which of the following is an example of ordinal data?A. morning commute (in miles) of teachers at Midtown High School
B. 1st, 2nd, and 3rd place finishers of the 2000 Boston Marathon
C. ocean temperature at seven beaches along the east coast of the U.S.Correct Answer: B
Practice Question 11
A person's social security number is an example of which level of measurement?A. nominal
B. ordinal
C. intervalCorrect Answer: A
The correct answer is nominal, since a person's social security number -although numeric - is just a label. Social security numbers cannot be ordered or ranked in any meaningful way.
Practice Question 12
An analyst gathers the price-earnings ratios (P/E) for the firms in the S&P 500 and then ranks the firms from highest to lowest P/E. She assigns the number 1 to the group with the lowest P/E ratios, the number 2 to the group with the second lowest P/E ratios, and so on. The measurement scale used by the analyst is best described as ______.A. nominal
B. ordinal
C. intervalCorrect Answer: B
The analyst is using an ordinal scale which involves sorting data into categories based on some characteristic (here, the firms' P/E ratios).

Study notes from a previous year's CFA exam:
1. Data Types