Why should I choose AnalystNotes?
AnalystNotes specializes in helping candidates pass. Period.
Subject 5. Data Visualization
Histogram and Frequency Polygon
A histogram is a bar chart that displays a frequency distribution. It is constructed as follows:
- The class frequencies are shown on the vertical (y) axis (by the heights of bars drawn next to each other).
- The classes (intervals) are shown on the horizontal (x) axis.
- There is no space between the bars.
From a histogram, we can see quickly where most of the observations lie. The shapes of histograms will vary, depending on the choice of the size of the intervals. The frequency polygon is another means of graphically displaying data. It is similar to a histogram but the bars are replaced by a line joined together. It is constructed in the following manner:
- Absolute frequency for each interval is plotted on the vertical (y) axis.
- The midpoint of each class (interval) is shown on the horizontal (x) axis.
- Neighboring points are connected with a straight line.
Unlike a histogram, a frequency polygon adds a degree of continuity to the presentation of the distribution.
It is helpful, when drawing a frequency polygon, first to draw a histogram in pencil, then to plot the points and join the lines, and finally to rub out the histogram. In this way, the histogram can be used as an initial guide to drawing the polygon.
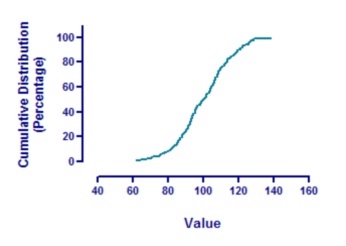
A cumulative frequency distribution chartis the sum of the class and all classes below it in a frequency distribution.
Bar Chart
A bar chart is a way of summarizing a set of categorical data. The height of each bar is proportional to a specific aggregation (for example the sum of the values in the category it represents). The categories could be something like an age group or a geographical location. A bar chart usually compares different categories. It is useful for looking at a set of data and making comparisons.
Although they look the same, bar charts and histograms have one important difference: they plot different types of data. Plot discrete data on a bar chart, and plot continuous data on a histogram.
A bar chart is used for when you have categories of data: Types of movies, music genres, or dog breeds. It's also a good choice when you want to compare things between different groups. You could use a bar graph if you want to track change over time as long as the changes are significant (for example, decades or centuries). If you have continuous data, like people's weights or IQ scores, a histogram is best.
Grouped bar charts or stacked bar charts can present the frequency distribution of multiple categorical variable simultaneously.
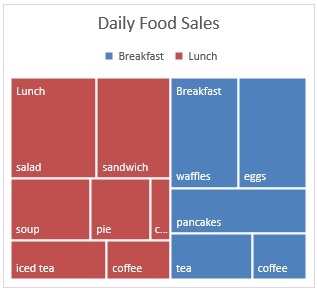
Tree-Map
Tree-maps are an alternative way of visualizing the hierarchical structure of a tree diagram while also displaying quantities for each category via area size. Each category is assigned a rectangle area with their subcategory rectangles nested inside of it.
The main advantages:
- identify the relationship between two elements in a hierarchical data structure;
- accurately display multiple elements together;
- show ratios of each part to the whole;
- visualize attributes by size and color coding.
The downside to a tree-map is that it doesn't show the hierarchal levels as clearly as other charts.
Word Cloud
A word cloud is a novelty visual representation of text data, typically used to depict keyword metadata on websites, or to visualize free form text. Tags are usually single words, and the importance of each tag is shown with font size or color.
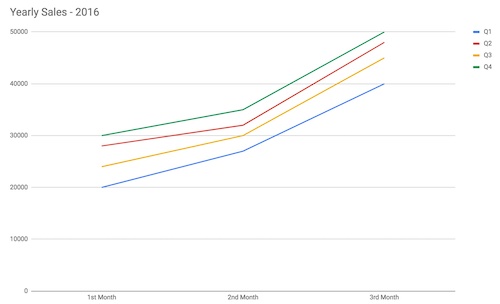
Line Chart
A line chart is generally used to show trend of a measure (or a variable) over time. Using a line chart, one can see the pattern of any dependent variable over time like share price, EPS of a company, weather recordings (like temperature, precipitation or humidity), etc.
Why do you need a Line Chart?
1. To see changes of a dependent variable over time.
2. To identify trends and spot spikes and dips
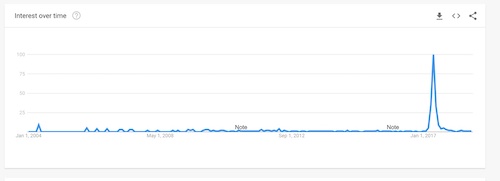
3. To compare patterns of multiple sections
Scatter Plot
A scatter plot (aka scatter chart, scatter graph) uses dots to represent values for two different numeric variables. The position of each dot on the horizontal and vertical axis indicates values for an individual data point. Scatter plots are used to observe relationships between variables.
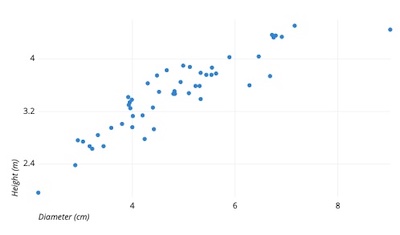
Relationships between variables can be described in many ways: positive or negative, strong or weak, linear or nonlinear.
Scatter plots are a powerful tool for finding patterns between two variables, for assessing data range, and for spotting extreme values.
Through the use of a "Line of Best Fit" or a trend line, scatter plots to help identify trends.
Two common issues have been identified with the use of scatter plots - over-plotting and the interpretation of causation as correlation.
Over-plotting occurs when there are too many data points to plot, which results in the overlapping of different data points. It can make relationship identification between variables challenging.
Concerning correlation, it is important to remember that correlation does not mean that the changes observed in one variable are responsible for the changes observed in another variable. Correlation should not be interpreted as causation. Causation implies that an event occurring will have an impact on an outcome.
Heat Map
A heat map is data analysis tool that uses color the way a bar graph uses height and width. It organizes and summarizes data in a tabular format and represents it using a color spectrum. It is often used in displaying frequency distributions or visualizing the degree of correlation among different variables.
Guide to Selecting among Visualization Types
The key consideration when selecting among chart types is the intended purpose of visualizing data. That is, whether it is for exploring/presenting distributions or relationships or for making comparisons. Exhibit 34 in the textbook is a great summary for the purpose.
Practice Question 1
Use the following frequency histogram to answer the question:
Which set of data is represented by the histogram?
A. 1, 3, 3, 3, 3, 3, 3, 5, 5, 5, 5, 5, 6, 6, 6, 6, 6, 6
B. 4, 6, 7, 8, 9, 10, 10, 13, 13, 13, 14, 16, 17, 17, 18, 19, 20, 21
C. 1, 5, 6, 7, 9, 9, 10, 13, 13, 14, 14, 15, 15, 17, 18, 19, 20, 20
D. 3, 5, 5, 8, 9, 11, 12, 13, 13, 14, 15, 15, 17, 17, 17, 18, 18, 20Correct Answer: D
Practice Question 2
For the bar graph of the frequency distribution shown, the frequency for 18 is ______.
A. 13
B. 30
C. 25Correct Answer: C
Reading along the horizontal axis to the mark for 18 then up the bar and over to the vertical axis, we see 25. So, the frequency for 18 is 25. That is, in this data collection, there are 25 scores that are 18s.
Practice Question 3
For the frequency distribution represented by the bar graph below, the range is ______.
A. 16
B. 21
C. 6Correct Answer: C
For a set of data, the range is the highest value minus the lowest value. For the data represented by the bar graph, the highest x-value is 21.5 and the lowest x-value is 15.5. So, the range is 21.5 - 15.5 (or 6). Note that if this bar graph represented a grouped frequency distribution, the range could not be found.
Practice Question 4
Which of the following statements concerning a frequency histogram and a relative frequency histogram constructed from the same data set are true?I. The shapes are the same.
II. The horizontal scales are the same.
III. The vertical scales are the same.Correct Answer: I and II
Practice Question 5
In a histogram, the vertical axis displays ______.A. the midpoint of each class
B. the class width of each interval
C. the frequency of each classCorrect Answer: C
Practice Question 6
Which of the following is different when comparing a frequency histogram to a relative frequency histogram for the same set of data?A. the shapes of the histograms
B. the vertical scales
C. the horizontal scalesCorrect Answer: B
Practice Question 7
You�re thinking of opening a bargain grocery store and you want to know how many people in a particular geographic area spend up to $6000 per person per year in groceries. Your table looks like this:

Which data visualization tool would be the best for your decision?
A. HistogramB. Frequency polygon
C. Cumulative frequency distribution chartCorrect Answer: C

Practice Question 8
______ provide a visual presentation of categorical data.
A. HistogramsB. Polygons
C. Bar chartsCorrect Answer: C
A bar chart is used to plot the frequency distribution of categorical data, with each bar representing a distinct category and the bar's height (or length) proportional to the frequency of the corresponding category.
Practice Question 9
Which statement is false regarding a bar chart?
A. Since categories are nominal data with no logical ordering, the bars cannot be arranged in any order.B. The bars can be vertical or horizontal.
C. A bar graph compares different categories.Correct Answer: A
Categories can be ordered by frequency. For example, a Pareto chart is a type of chart that contains both bars and a line graph, where individual values are represented in descending order by bars, and the cumulative total is represented by the line.
Practice Question 10
Which tool is best to facilitates showing changes in the data over time and understanding trends?
A. bar chartB. line chart
C. tree-mapCorrect Answer: B
A line chart (graph) is a type of chart used to show information that changes over time.
Practice Question 11
Which visualization tool is appropriate for comparing among categories?
A. histogramB. scatter plot
C. bar chartCorrect Answer: C
Practice Question 12
Which visualization tool is appropriate for analyzing unstructured data?
A. bubble chartB. heat map
C. word cloudCorrect Answer: C
Practice Question 13
The following table gives the stock price, dividend, and percentage return for 10 months.Month; Stock Price; Dividend; Total Return (%)
Jan; 76.3; 1.53; 9.81
Feb; 72.5; 1.45; -3.08
Mar; 70.4; 1.41; -0.95
Apr; 69.8; 1.4; 1.14
May; 71.2; 1.42;
Jun; 73.6; 1.47; 5.44
Jul; 73.7; 1.47; 2.13
Aug; 73; 1.46; 1.03
Sep; 69.5; 1.39; -2.89
Oct; 67.9; 1.36; -0.35
If one were to construct a frequency histogram for the stock prices using 3 classes, the first interval would be which of the following?
A. 67.9 up to 70.7
B. 67.9 up to 72.7
C. 70.7 up to 72.7Correct Answer: A
If 3 intervals are to be used then the length of the intervals is (76.3 - 67.9)/3 = 2.8, so the first interval would be from 67.9 up to 67.9 + 2.8 = 70.7.
Practice Question 14
If a frequency distribution has open-ended intervals at its extremes, which measure of central tendency is the most difficult to estimate?A. Mean
B. Median
C. Mode Correct Answer: A
The mean measurement is the most difficult to estimate because in a frequency distribution we do not necessarily know what the extreme values are (especially in an open-ended class). Therefore, the mean which is very sensitive to extreme values will be difficult to determine.
Practice Question 15
A discrete probability distribution is the same as ______.A. a collection of all possible outcomes of an experiment
B. an absolute frequency distribution
C. a relative frequency distributionCorrect Answer: C
The relative probability distribution of a set shows relative frequency in each category in which the observation set is subdivided (i.e.. the percentage of the observation set lying in each class). This also represents the probability distribution of the observation set.
Practice Question 16
The following table gives a stock price, dividend, and percentage return for 10 months.
If one were to construct a frequency histogram for the stock prices using 3 classes, what percentage of stocks would fall in the second stock price interval?
A. 20%
B. 30%
C. 40%Correct Answer: B
Using 3 intervals, the second interval would be stock prices from $70.70 to $73.5; there are 3, so the relative frequency is 30%.
Practice Question 17
A large mass of data can best be summarized pictorially by means of ______.A. a range
B. a histogram
C. a frequency tableCorrect Answer: B
Practice Question 18
A discrete uniform distribution is defined over the range, X = 2 to 6. What is the cumulative probability that the observations 4, 5 and 6 will be observed?A. 60%
B. 20%
C. 50%Correct Answer: A
This distribution is defined over five discrete outcomes, each with a probability of 0.2 (= 1/5). Thus, the cumulative probability of observing 4, 5, and 6 would be 3 x 0.2 = 0.6, or 60%.
Practice Question 19
An analyst gathers the following information about the price-earnings (P/E) ratios for the common stocks held in a portfolio:Interval | P/E range | Frequency
I | 8.00 - 16.00 | 20
II | 16.00 - 24.00 | 52
III | 24.00 - 30.00 | 24
IV | 30.00 - 38.00 | 14
The relative frequency for Interval II is closest to ______.
A. 45.85%
B. 47.27%
C. 52.78%Correct Answer: B
52 / (20 + 52 + 24 + 14) = 47.27%
Practice Question 20
A random variable with a finite number of equally likely outcomes is best described by a ______.A. discrete uniform distribution
B. binomial distribution
C. continuous uniform distributionCorrect Answer: A
A random variable has a discrete uniform distribution when there is a finite number of equally likely specified outcomes.
Practice Question 21
Which visualization tool is appropriate for comparing variables over time?A. line chart
B. scatter plot
C. bar chartCorrect Answer: A
A line chart (graph) is a type of chart used to show information that changes over time.
Practice Question 22
Which of the following most likely represents the graph which is drawn by connecting successive mid-points in a histogram by straight lines:A. Frequency curve
B. Frequency polygon
C. Line graphCorrect Answer: B
When successive mid-points in a histogram are connected by straight lines, the graph is called a frequency polygon.

Study notes from a previous year's CFA exam:
5. Data Visualization