Why should I choose AnalystNotes?
AnalystNotes specializes in helping candidates pass. Period.
Subject 1. Demand Concepts
The quantity demanded of good X depends on its price, consumers' income, and the price of good Y, etc.
Prices influence consumers' purchase decisions. The demand function can be depicted as a negatively sloped demand curve.
- If all other factors are equal, as the price of a good rises, consumer demand falls. This is mainly due to the availability of substitutes, which are goods that perform similar functions.
- As the price of a good falls, consumer demand rises.
Therefore, there is an inverse relationship between the price of a good and the amount that consumers are willing to buy. The demand curve normally slopes downward. It tells the analyst the quantity that consumers are willing to buy for each possible price when all other influences on consumers' planned purchases remain the same.
Example 1
Refer to the graph below. What is the quantity of cassettes demanded when their price is $4.00 per week?
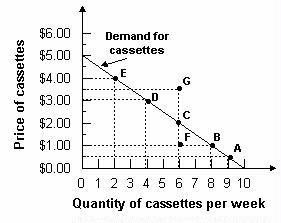
Answer: Two cassettes per week. The demand curve tells how much is demanded at each price. To determine the quantity demanded, find $4.00 on the vertical axis and read across until you meet the demand curve. Then read the quantity from the horizontal axis.
When any factor that influences buying plans, other than the price of the good, changes, there is a change in demand for that good. When the quantity of the good that people plan to buy changes at each and every price, there is a new demand curve. These factors include changes in income, number of consumers in the market, changes in the price of a related good, etc.
Example 2
Assume the graph below reflects demand in the automobile market. Which arrow best captures the impact of increased consumer income on the automobile market?
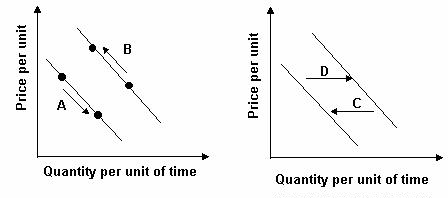
Answer: D. Income is a shift factor of demand. An increase in income increases the number of automobiles demanded at each price. Therefore demand has shifted to the right.
- When demand increases, the quantity that people plan to buy increases at each and every price, so the demand curve shifts rightward.
- When demand decreases, the quantity that people plan to buy decreases at each and every price, so the demand curve shifts leftward.
Practice Question 1
In the demand function, Py refers to the price of another good, Y. This good can be a ______.
I. substitute
II. complement
III. inferior good
Practice Question 2
In the demand function for normal good x, Qx = A + B x Px + C x I + D x Py, we are certain that ______.
A. A > 0
B. B > 0
C. C > 0
D. D > 0
The definition of a normal good indicates the higher the income, the higher the demand.
Practice Question 3
Suppose X and Y are complements. This indicates that in the demand function for X, Qx = A + B x Px + C x I + D x Py, ______.A. B > 0
B. D > 0
C. D < 0Correct Answer: C
Complements have a negative cross-price elasticity of demand. Both B and D should be negative.
Practice Question 4
In the demand function for inferior good x, Qx = A + B x Px + C x I + D x Py, we are certain that ______.A. C < 0
B. B > 0
C. D < 0Correct Answer: A
Goods with negative income elasticity are called inferior goods.
Practice Question 5
In the demand function for good x and its complement y, Qx = A + B x Px + C x I + D x Py, we are certain that ______.A. C < 0
B. B > 0
C. D < 0Correct Answer: C
Cross-price elasticity is negative for complements. Their consumption goes up or down together, as the price of one good goes up, the demand for both falls.
Practice Question 6
Suppose X and Y are substitutes. This indicates that in the demand function for X, Qx = A + B x Px + C x I + D x Py, ______.A. C > 0
B. B < 0
C. D > 0Correct Answer: C
If Y's price rises, a consumer would tend to purchase much less of Y and switch to the less costly substitute (X).
Practice Question 7
The demand function for good X is Qx= 30 - 4.5 x Px + 0.1 x I. X is most likely to be a ______.A. normal good
B. Veblen good
C. Giffen goodCorrect Answer: A
The -4.5 indicates the higher its own price, the less it is consumed. Therefore, it is not a Veblen good.
The 0.1 indicates the higher the income, the more the good is consumed. Therefore, it is not a Giffen good.
Practice Question 8
The demand function for good X is Qx= 125 + 16 x Px + 38 x I. X is most likely to be a ______.A. normal good
B. Veblen good
C. Giffen goodCorrect Answer: B
The 16 indicates the higher its own price, the more it is consumed. It is not a normal good. The 38 indicates the higher the income, the more the good is consumed. Therefore it is not a Giffen good.

Study notes from a previous year's CFA exam:
1. Demand Concepts