- CFA Exams
- 2026 Level II
- Topic 5. Equity Valuation
- Learning Module 23. Market-Based Valuation: Price and Enterprise Value Multiples
- Subject 9. Enterprise Value / EBITDA Ratio
Seeing is believing!
Before you order, simply sign up for a free user account and in seconds you'll be experiencing the best in CFA exam preparation.
Subject 9. Enterprise Value / EBITDA Ratio PDF Download
Since EBITDA are distributed between all types of investors in the company (common shareholders, preferred shareholders and creditors), it reflects the fundamental value of the company as a whole. Therefore, a multiple using total company value is logically more appropriate. EV/EBITDA ratio responds to this need.EV = MV of common stock + MV of preferred stock + MV of debt - cash and investments
Tax Expense = (Net Income / (1 - Tax Rate)) - Net Income = [34.0 / (1 - 0.25)] - 34.0 = 11.3.
EBITDA = 34.0 + 7.62 + 17.2 + 11.3 = 70.12.
Yield to maturity = 4.13%.
Semi-annual coupon payments = 2MM.
Face Value = 200MM.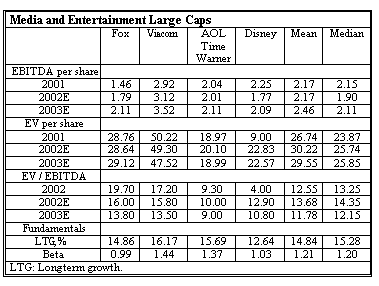
Enterprise value (EV) is total company value minus the value of cash and investments.
EV/EBITDA is an indication of company value, not equity value.
Example
- Net income: 34.0.
- Interest Expense: 7.62.
- Cash outflow for interest payments: 4.0.
- Depreciation and Amortization: 17.2.
- Marginal tax rate: 25%.
- Cash and marketable securities: 8.9.
- Investments: 6.2.
- Price per common share on the Paris Stock Exchange: 13.8.
- Total number of shares issued: 20,000,000.
- Total number shares in treasury stock: 1,320,000.
The company's financials show that the only interest-paying liability assumed by the company is a 5-year $200MM note maturing in 3 years' time and currently trading at 4.13%. The note is paying semi-annual coupons and all interest payments have been met so far.
The company also has preferred stock that is not trading on any exchange. The book value of preferred stock is $45. No preferred dividends are currently in arrears.
Solution:
1. Calculation of EBITDA
EBITDA = Net Income + Interest Expense + Depreciation and Amortization + Tax Expense.
Tax Expense = (Net Income / (1 - Tax Rate)) - Net Income = [34.0 / (1 - 0.25)] - 34.0 = 11.3.
EBITDA = 34.0 + 7.62 + 17.2 + 11.3 = 70.12.
2. Calculation of Enterprise Value (EV)
Total market value of common stock = price per share of common stock x number of shares outstanding = Price per share x (shares issued - treasury stock) = 13.8 x (20,000,000 - 1,320,000) = 257.7 MM
Since the company's preferred stock is not publicly traded, we will use its book value for calculation of EV.
Semi-annual coupon on the bond = Cash Outflow for Interest Payments / 2 = 4 / 2 = 2.
We know the bond's term to maturity = 3 years.
Yield to maturity = 4.13%.
Semi-annual coupon payments = 2MM.
Face Value = 200MM.
Therefore, we can calculate the bond's total current market value = $188.1.
EV = Total market value of common stock + Total market value of preferred stock + Total market value of debt - Cash balances - Investments = 257.7 + 45.0 + 188.1 - 8.9 - 6.2 = 475.7.
3. Calculation of EV/EBITDA ratio
EV/EBITDA = 475.7 / 70.12 = 6.78
Advantages:
- EBITDA is more often positive than net income.
- By adding back depreciation and amortization, EBITDA is invariant to the depreciation method used. EV/EBITDA ratio is often used for valuation of capital-intensive companies.
- It is more appropriate than P/E for comparing companies with different financial leverage, since EBITDA is not influenced by interest expense.
Disadvantages:
- When capital expenditures do not equal the depreciation, EBITDA is not a technically correct proxy to cash flow. This qualification to EBITDA comparisons can be meaningful for the capital-intensive businesses to which EV/EBITDA is often applied.
- EBITDA does not account for changes in the working capital, which makes it even more distinct from the correct cash flow definition.
- EBITDA includes non-cash revenues due to the accrual accounting principle.
Valuation Based on Forecasted Fundamentals
The fundamental drivers of EV/EBITDA are the expected growth rate in free cash flow to the firm and the weighted average cost of capital. The justified EV/EBITDA based on fundamentals bears a positive relationship to the first factor and an inverse relationship to the second.
Valuation Using Comparables
- Firm EV/EBITDA < benchmark: undervalued.
- Firm EV/EBITDA > benchmark: overvalued.
Example
Fox Entertainment has the highest multiple due to its near-average growth and the lowest risk among the four compared companies. Disney demonstrates even lower growth, essentially the same level of risk as Fox, and consequently trades at the lowest multiple among the comparables. Viacom seems to be overvalued relative to AOL Time Warner: both companies have beta around 1.4, very close growth rate about 16%, but based on the leading EV/EBITDA AOL Time Warner is trading with 10/15.8 - 1 = 37% discount to Viacom.
User Contributed Comments 5
| User | Comment |
|---|---|
| bbadger | How did they get the bond current market value of $188.1m? |
| charliedba | The bond's term to maturity = 3 years. Yield to maturity = 4.13%. Semiannual coupon payments = 2MM. Face Value = 200MM. You can use a spreadsheet to calculate the present value. Anyway, that's not the main point here. |
| davcer | Use the cashflows in the baii |
| birdperson | @bbadger N=6 (3Y *2) I/Y = 4.13/2 PMT = -2 FV = -200 CPT PV = 188.1 |
| davidt876 | birdperson saving the day |

Thanks again for your wonderful site ... it definitely made the difference.

Craig Baugh
My Own Flashcard
No flashcard found. Add a private flashcard for the subject.
Add