- CFA Exams
- 2026 Level I
- Topic 1. Quantitative Methods
- Learning Module 7. Estimation and Inference
- Subject 1. Sampling Methods
Why should I choose AnalystNotes?
Simply put: AnalystNotes offers the best value and the best product available to help you pass your exams.
Subject 1. Sampling Methods PDF Download
Population and Sample
A population consists of an entire set of objects, observations, or scores that have something in common. It comprises every possible member of the specified group. A sample is a subset of a population. The sample is comprised of some of the members of the population. Since it is usually impractical (or too expensive or time-consuming) to test every member of a population, using data gathered from a sample of the population is typically the best approach available for describing that population.
A parameter is a numerical quantity measuring some aspect of a population of scores. The mean, for example, is a measure of central tendency. Parameters are rarely known and are usually estimated by statistics computed in samples.
Estimates of these parameters taken from a sample are called statistics.
Hint: One way to easily remember these terms is to recall that "population" and "parameter" both start with a "p," and "sample" and "statistic" both start with a "s."
In investment analysis, it is often impossible to study every member of a population. Even if analysts could examine an entire population, it may not be economically efficient to do so.
Sampling is the process of obtaining a sample.
Simple Random Sampling
A simple random sample is a sample obtained in such a way that each element of a population has an equal probability of being selected. The selection of any one element has no impact on the chance of selecting another element.
A sample is random if the method for obtaining the sample meets the criterion of randomness (each element having an equal chance at each draw). "Simple" indicates that this process is not difficult, and "random" indicates that you don't know in advance which observations will be selected in the sample. The actual composition of the sample itself does not determine whether or not it's a random sample.
Example
Suppose that a company has 30 directors, and you wish to choose 10 of them to serve on a committee. You could place the names of the 30 directors on separate pieces of paper and draw them out one by one until you have drawn a sample of 10.
Note that the conditions for simple random sampling have been satisfied in that every one of the 30 directors has an equal (non-zero) chance of being selected in the sample.
In this example, it makes no sense to sample with replacement, as this would mean that once you have drawn a name, that name goes back into the hat (it is replaced), and can be drawn again. If the same person's name is drawn more than once, you won't end up with a sample size 10 if you draw 10 names; this experiment should therefore be done without replacement.
Sampling Error
The sample taken from a population is used to infer conclusions about that population. However, it's unlikely that the sample statistic would be identical to the population parameter. Suppose there is a class of 100 students and a sample of 10 from that class is chosen. If, by chance, most of the brightest students are selected in this sample, the sample will provide a misguided idea of what the population looks like (because the sample mean x-bar will be much higher than the population mean in this case). Equally, a sample comprising mainly weaker students could be chosen, and then the opposite applicable characteristics would apply. The ideal is to have a sample which comprises a few bright students, a few weaker students, and mainly average students, as this selection will give a good idea of the composition of the population. However, because which items go into the sample cannot be controlled, you are dependent to some degree on chance as to whether the results are favorable (indicative of the population) or not.
Sampling error (also called error of estimation) is the difference between the observed value of a statistic and the quantity it is intended to estimate. For example, sampling error of the mean equals sample mean minus population mean.
Sampling error can apply to statistics such as the mean, the variance, the standard deviation, or any other values that can be obtained from the sample. The sampling error varies from sample to sample. A good estimator is one whose sample error distribution is highly concentrated about the population parameter value.
Sampling error of the mean would be: Sample mean - population mean = x-bar - μ.
Sampling error of the standard deviation would be: Sample standard deviation - population standard deviation = s - σ.
Note that sampling error is not a bias. A biased sample is one in which the method used to create the sample results in samples that are systematically different from the population. For instance, consider a research project on attitudes toward sex. Collecting the data by publishing a questionnaire in a magazine and asking people to fill it out and send it in would produce a biased sample. People interested enough to spend their time and energy filling out and sending in the questionnaire are likely to have different attitudes toward sex than those not taking the time to fill out the questionnaire.
It is important to realize that it is the method used to create the sample, not the actual makeup of the sample, that defines the bias. A random sample that is very different from the population is not biased: it is by definition not systematically different from the population. It is randomly different.
Sampling Distribution
A sample statistic itself is a random variable, which varies depending upon the composition of the sample. It therefore has a probability distribution. The sampling distribution of a statistic is the distribution of all the distinct possible values that the statistic can assume when computed from samples of the same size randomly drawn from the same population. The most commonly used sample statistics include mean, variance, and standard deviation.
If you compute the mean of a sample of 10 numbers, the value you obtain will not equal the population mean exactly; by chance, it will be a little bit higher or a little bit lower. If you sampled sets of 10 numbers over and over again (computing the mean for each set), you would find that some sample means come much closer to the population mean than others. Some would be higher than the population mean and some would be lower. Imagine sampling 10 numbers and computing the mean over and over again, say about 1,000 times, and then constructing a relative frequency distribution of those 1,000 means. This distribution of means is a very good approximation to the sampling distribution of the mean. The sampling distribution of the mean is a theoretical distribution that is approached as the number of samples in the relative frequency distribution increases. With 1,000 samples, the relative frequency distribution is quite close; with 10,000, it is even closer. As the number of samples approaches infinity, the relative frequency distribution approaches the sampling distribution.
The sampling distribution of the mean for a sample size of 10 is just an example; there is a different sampling distribution for other sample sizes. Also, keep in mind that the relative frequency distribution approaches the sampling distribution as the number of samples increases, not as the sample size increases, since there is a different sampling distribution for each sample size.
A sampling distribution can also be defined as the relative frequency distribution that would be obtained if all possible samples of a particular sample size were taken. For example, the sampling distribution of the mean for a sample size of 10 would be constructed by computing the mean for each of the possible ways in which 10 scores could be sampled from the population and creating a relative frequency distribution of these means. Although these two definitions may seem different, they are actually the same: Both procedures produce exactly the same sampling distribution.
Statistics other than the mean have sampling distributions too. The sampling distribution of the median is the distribution that would result if the median instead of the mean were computed in each sample.
Sampling distributions are very important since almost all inferential statistics are based on sampling distributions.
Stratified Random Sampling
In stratified random sampling, the population is subdivided into subpopulations (strata) based on one or more classification criteria. Simple random samples are then drawn from each stratum (the sizes of the samples are proportional to the relative size of each stratum in the population). These samples are then pooled.
It is important to note that the size of the data in each stratum does not have to be the same or even similar, and frequently isn't.
Stratified random sampling guarantees that population subdivisions of interest are represented in the sample. The estimates of parameters produced from stratified sampling have greater precision (i.e., smaller variance or dispersion) than estimates obtained from simple random sampling.
For example, investors may want to fully duplicate a bond index by owning all the bonds in the index in proportion to their market value weights. This is known as pure bond indexing. However, it's difficult and costly to implement because a bond index typically consists of thousands of issues. If simple sampling is used, the sample selected may not accurately reflect the risk factors of the index. Stratified random sampling can be used to replicate the bond index.
- Divide the population of index bonds into groups with similar risk factors (e.g., issuer, duration/maturity, coupon rate, credit rating, call exposure, etc.). Each group is called a stratum or cell.
- Select a sample from each cell proportional to the relative market weighting of the cell in the index.
A stratified sample will ensure that at least one issue in each cell is included in the sample.
Cluster Sampling
Cluster sampling is a process of dividing a population into multiple groups/clusters. The clusters must be representative of the total population. A simple random sample of the cluster is chosen and the elements in each of these clusters are then sampled.
There are single-stage, two-stage, or multiple-stage sampling methods in cluster sampling. These methods depend upon the number of steps required to create the desired sample.
Cluster Sampling versus Stratified Sampling
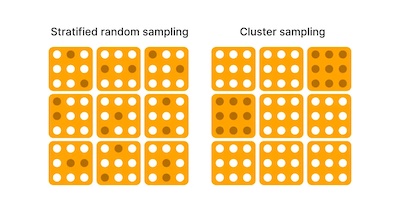
- In Cluster Sampling, the sampling is done on a population of clusters therefore, cluster/group is considered a sampling unit. In Stratified Sampling, elements within each stratum are sampled.
- In Cluster Sampling, only selected clusters are sampled. In Stratified Sampling, from each stratum, a random sample is selected.
Cluster sampling is advantageous when a large population is in need of a survey because it is less costly.
Non-Probability Sampling
Non-probability sampling is defined as a sampling technique in which the researcher selects samples based on the subjective judgment of the researcher rather than random selection. Researchers use this method in studies where it is impossible to draw random probability sampling due to time or cost considerations.
Convenience sampling is a non-probability sampling technique where samples are selected from the population only because they are conveniently available to the researcher.
In the judgmental sampling method, researchers select the samples based purely on the researcher's knowledge and credibility. In other words, researchers choose only those people who they deem fit to participate in the research study.
User Contributed Comments 6
| User | Comment |
|---|---|
| gurpix | How do I make sure that my sample is random |
| tabulator | Nice little example about sex survey. |
| achu | sampling distrib. defn: based on samples of SAME size. It is logical that different sample sizes can't be put together. |
| jb1969 | biased sample : It is important to realize that it is the method used to create the sample not the actual make up of the sample itself that defines the bias. Random sample very different from the population is randomly very different but not biased. |
| sgossett86 | You guys are a trip. Except the smart ones. You're cool. |
| Yrazzaq88 | @gurpix: - No bias in your selection - You could use a random generator on a computer - You could randomly select, by not knowing which is which. |

I was very pleased with your notes and question bank. I especially like the mock exams because it helped to pull everything together.

Martin Rockenfeldt
My Own Flashcard
No flashcard found. Add a private flashcard for the subject.
Add