- CFA Exams
- 2026 Level I
- Topic 1. Quantitative Methods
- Learning Module 3. Statistical Measures of Asset Returns
- Subject 1. Measures of Central Tendency
Why should I choose AnalystNotes?
AnalystNotes specializes in helping candidates pass. Period.
Subject 1. Measures of Central Tendency PDF Download
The Arithmetic Mean
The population mean is the average for a finite population. It is unique; a given population has only one mean.
where:
- N = the number of observations in the entire population
- Xi = the ith observation
- ΣXi = add up Xi, where i is from 0 to N
The sample mean is the average for a sample. It is a statistic and is used to estimate the population mean.
where n = the number of observations in the sample
The arithmetic mean is the most common measure of where the data are centered. One drawback of the mean as a measure of central tendency is that it is very sensitive to extreme values or outliers.
Median
In English, the word "mediate" means to go between or to stand in the middle of two groups, in order to act as a referee, so to speak. The median does the same thing; it is the value that stands in the middle of the data set, and divides it into two equal halves, with an equal number of data values in each half.
To determine the median, arrange the data from highest to lowest (or lowest to highest) and find the middle observation. If there are an odd number of observations in the data set, the median is the middle observation (n + 1)/2 of the data set. If the number of observations is even, there is no single middle observation (there are two, actually). To find the median, take the arithmetic mean of the two middle observations.
The median is less sensitive to extreme scores than the mean. This makes it a better measure than the mean for highly skewed distributions. Looking at median income is usually more informative than looking at mean income, for example. The sum of the absolute deviations of each number from the median is lower than the sum of absolute deviations from any other number.
Note that whenever you calculate a median, it is imperative that you place the data in order first. It does not matter whether you order the data from smallest to largest or from largest to smallest, but it does matter that you order the data.
Mode
Mode means fashion. The mode is the "most fashionable" number in a data set; it is the most frequently occurring score in a distribution and is used as a measure of central tendency. A set of data can have more than one mode, or even no mode. When all values are different, the data set has no mode. When a distribution has one value that appears most frequently, it is said to be unimodal. A data set that has two modes is said to be bimodal.
The advantage of the mode as a measure of central tendency is that its meaning is obvious. Like the median, the mode is not affected by extreme values. Further, it is the only measure of central tendency that can be used with nominal data. The mode is greatly subject to sample fluctuations and, therefore, is not recommended for use as the only measure of central tendency. A further disadvantage of the mode is that many distributions have more than one mode. These distributions are called "multimodal."
Dealing with Outliers
There are three options:
- No adjustment. Appropriate if all values are equially important and meaningful.
- Remove all outliers. A trimmed meanis a method of averaging that removes a small percentage of the largest and smallest values before calculating the mean.
- Replace the outliers with another value. A winsorized mean adjusts any outliers' values to either an upper or lower limit. No observations are excluded from the calculation.
Measures of Location
The median is the value that divides a distribution in half. Quantities such as quartiles, quintiles, deciles and percentiles perform similar functions to the median in a data set.
Quartile
There are 3 quartiles in a data set. Between them, they divide the data into 4 equal parts or quarters. The first quartile is called the lower quartile and is often denoted as Q1. The second quartile is obviously just the median, as it is the middle value of the data set. The third quartile is called the upper quartile and is often denoted as Q3.
You should note that Q1 effectively splits the data set into the lower 25% of values and the upper 75% of values whereas Q3 splits the data into the lower 75% of values and the upper 25% of values.
The distance between Q1 and Q3, namely Q3 - Q1, is called the inter-quartile range; it gives an indication of the spread of the middle 50% of the data set.
Quintile
There are 4 quintiles in a data set. Between them, they divide the data into 5 equal parts or fifths. Quintiles are not very commonly used.
You should note that the first quintile effectively splits the data set into the lower 20% of values and the upper 80% of values; the second quintile splits the data set into the lower 40% of values and the upper 60% of values, and so on.
Decile
There are 9 deciles in the data set. Between them, they divide the data into 10 equal parts, or tenths.
Obviously, the fifth decile is the median, as it is the middle value in the data set.
Percentile
There are 99 percentiles in the data set. Between them, they divide the data into 100 equal parts, or hundredths.
The fiftieth percentile is the median, as it is the middle value in the data set. The sixty-third percentile divides the data set into the lower 63% of values and the upper 37% of values, and so on.
Note that the 75th percentile is also the same value as Q3, for example.
These types of values are used to rank investment performance, such as the performance of mutual funds.
In calculating these values, it is important to first order the data set, as we did with the median. Once this is done, it is necessary to find the position of the value that you are calculating, and then the value itself (the procedure is exactly the same as that for calculating the median).
A box and whiskers plot is a convenient way of visually displaying the data distribution through their quartiles. It shows a five number summary in a chart.
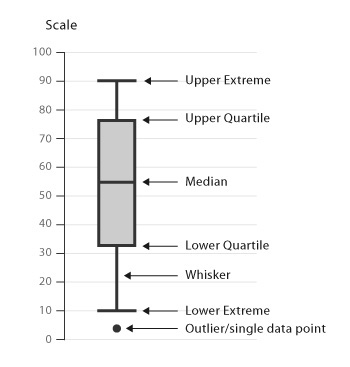
The main part of the chart (the "box") shows where the middle portion of the data is: the interquartile range. At the ends of the box, you find the first quartile (the 25% mark) and the third quartile (the 75% mark). The bottom of the chart is the minimum (the smallest number in the set) and the top is the maximum (the largest number in the set). Finally, the median is represented by a horizontal bar in the center of the box.
A boxplot tells us:
- Are there any outliers, and what are their values?
- Is the data symmetrical?
- How tightly is the data grouped.
- Is the data skewed and if so, in what direction?
User Contributed Comments 10
| User | Comment |
|---|---|
| clama | Remember the formula .... (N + 1) * Y/100 |
| itconcepts | just splitting hair - if there are only 3 quartiles in a data set (2nd one being the median, then there should only be 89 Precentiles - other made up of quintiles and deciles - hehe |
| tschorsch | there are not 3 quartiles because the 2nd one is the mean the 'tiles are divider lines thus, there are n-1 n-tiles i.e. for quartiles, they are at 25%, 50% and 75% for deciles they are at 10%, 20% .. 80%, 90% |
| Dohei | tschorsch you do mean median in the first line I assume? |
| Mosobalaje | Who has has a look at the CFA mock afternoon session. Here is what it says: 20. The following ten observations are a sample drawn from a normal population: 25, 20, 18, -5, 35, 21, -11, 8, 20, and 9. The fourth quintile (80th percentile) of the sample is closest to: A. 8.0 B. 21.0 C. 24.2 Answer = B ?Statistical Concepts and Market Returns,? Richard A. Defusco, CFA, Dennis W. McLeavey, CFA, Jerald E. Pinto, CFA, and David E. Runkle, CFA 2011 Modular Level I, Vol. 1, pp. 375-378 Study Session 2-7-f Describe, calculate and interpret quartiles, quintiles, deciles, and percentiles. Ranking the sample from smallest to largest, we have -11, -5, 8, 9, 18, 20, 20, 21, 25, and 35. The fourth quintile (80th percentile) is the eighth largest of these ordered numbers. The eighth largest number is 21. WHY IS THE ANSWER B? They did not even use the formula!!! |
| jayj001 | (N+1) * (Y/100) e.g. what is the 25th percentile / quartile 1? from a 15 observations. Therefore = (15+1) * (25/100) = the 4th observation |
| Vladimir25 | hi all, I still cannot find the right answer/explanation on the CFA mock question posted above by Mosobalaje (80th percentile of the sample). Whole chapter regarding quantiles is based on the formula (n+1) * y/100 and linear interpolation, and then suddenly they use some different approach to resolve this problem!? What might be the explanation here is that sample is taken from normal distribution and number of observations is less than 30, so we should use t-score and create one-side confidence interval (upper limit only). Using this approach I end up with some number close to 18, and then 21 is indeed correct answer, but I don't know if this is correct approach at all. Any thoughts? |
| 8937558 | Silly question: is there a way to sort data in ascending order using the Texas Instruments BAII calculator? |
| ko960531 | Vladimir, your interpretation will not apply because the question SPECIFIED that it is a normal distribution |
| ko960531 | The explanation, I believe, is that: n=10, each one represents 10 percentile, 80 percentile = 8th. |

Thanks again for your wonderful site ... it definitely made the difference.

Craig Baugh
My Own Flashcard
No flashcard found. Add a private flashcard for the subject.
Add