- CFA Exams
- 2026 Level I
- Topic 1. Quantitative Methods
- Learning Module 4. Probability Trees and Conditional Expectations
- Subject 2. Probability Trees and Conditional Expectations
Seeing is believing!
Before you order, simply sign up for a free user account and in seconds you'll be experiencing the best in CFA exam preparation.
Subject 2. Probability Trees and Conditional Expectations PDF Download
The Total Probability Rule
If we have an event or scenario S, the event not-S, called the complement of S, is written SC. Note that P(S) + P(SC) = 1, as either S or not-S must occur.
The total probability rule explains the unconditional probability of an event in terms of probabilities conditional on the scenarios.
- P(A) = P(A|S)P(S) + P(A|SC)P(SC)
- P(A) = P(A|S1)P(S1) + P(A|S2)P(S2) + ... + P(A|Sn)P(Sn)
- The first equation is just a special case of the second equation.
- The second equation states the following: the probability of any event [P(A)] can be expressed as a weighted average of the probabilities of the event, given scenarios [terms such as P(A|S1)]; the weights applied to these conditional probabilities are the respective probabilities of the scenarios [terms such as P(A1 multiplying P(A|S1)], and the scenarios must be mutually exclusive and exhaustive.
Suppose there are two events:
- Event A: IBM's revenue will increase.
- Event B: the economy is going into an expansion. P(B) = 0.6, and therefore P(Bc) = 0.4.
The probability of an increase in IBM's revenue given an economic expansion is P(A|B) = 0.8.
The probability of an increase in IBM's revenue given no economic expansion is P(A|Bc) = 0.7.
Using the total probability rule, we can compute the probability of an increase in IBM's revenue: P(A) = P(A|B) x P(B) + P(A|Bc) x P(Bc) = 0.8 x 0.6 + 0.7 x 0.4 = 0.76.
Typical exam question
An analyst constructs the following probability table for the market and Company X's stock:
1. Compute the total probability of good performance for Company X's stock.
Here we are asked to find the total probability of good performance. This means we have to find the joint probability of one stock outcome. To do this we multiply and add.
We take Σ (probability of economic state x good conditional probability): Joint probability = (0.5 x 0.4) + (0.3 x 0.5) + (0.2 x 0.5) = 45%
2. Compute the probability of simultaneously realizing a bull economy and poor stock performance for Company X.
This question asks you to determine the probability of a specific branch. If we follow the branch and multiply the probabilities, we will arrive at the correct answer as follows.
Bull economy: 0.5
Poor stock: 0.3
Probability = 0.5 x 0.3 = 0.15 = 15%
Parallel to the total probability rule for stating unconditional probabilities in terms of conditional probabilities, total probability rule for expected value states (unconditional) expected values in terms of conditional expected values.
- E(X) = E(X|S)P(S) + E(X|SC)P(SC)
- E(X) = E(X|S1)P(S1) + E(X|S2)P(S2) + ... + E(X|Sn)P(Sn)
(where S1, S2, ..., Sn are mutually exclusive and exhaustive scenarios or events.)
The general case, equation 2, states that the expected value of X equals the expected value of X given Scenario 1, E(X|S1), times the probability of Scenario 1, P(S1), plus the expected value of X given Scenario 2, E(X|S2), times the probability of Scenario 2, P(S2), and so on.
In investments, we make use of any relevant information available in making our forecast. When we refine our expectations or forecasts, we are typically making adjustments based on new information or events; in these cases we are using conditional expected values. The expected value of a random variable X given an event or scenario S is denoted E(X|S).
Relating the formula to the example above and using the following notation:
X = revenue, F = favorable weather, M = moderate weather, U = unfavorable weather, the formula becomes:
E(X) = E (X|F) x P(F) + E (X|M) x P(M) + E(X|U) x P(U)
Note that the right-hand side has three terms because there are three possible weather scenarios.
The E terms on the right are calculated as follows:
E (X|F) = Expected value (Revenue | Favorable weather) = 200,000, because if the weather is favorable, the revenue will be $200,000.
Similarly, E (X|M) = 80,000 and E(X|U) = 0.
So, E(X) = 200,000 x 0.2 + 80,000 x 0.3 + 0 x 0.5 = 40,000 + 24,000 + 0 = 64,000.
This is the same answer that we calculated before; the formula above is just another way of carrying out the same calculation.
Note that had there been ten different weather scenarios, the right-hand side would contain ten different terms. The key information is that the different weather scenarios are both mutually exclusive and exhaustive.
Probability Tree
Probability trees are useful for calculating combined probabilities for sequences of events. It helps you to map out the probabilities of many possibilities graphically, without the use of complicated probability formulas.
A probability tree has two main parts: the branches and the ends(sometimes called leaves). The probability of each branch is generally written on the branches, while the outcome is written on the ends of the branches. In general you multiply along the branches and add probabilities down the columns (up to 1).
Example
Suppose a farmer must decide what to do with his land for the next growing season. He can choose to plant corn or soybeans or to not plant anything at all. If he plants nothing at all, the government farm subsidy will pay him $30 per acre.
If the farmer decides to plant corn or soybeans on his land, there is some risk involved. The yield per acre depends on the amount of rainfall. Too much rain or too little rain will give poorer results than the right amount of rainfall. There is a 40 percent probability that the rainfall will be low; there is a 40 percent probability that the rainfall will be medium; and there is a 20 percent chance that the rainfall will be high.
If the farmer decides to plant corn, the yield per acre will be $0, $90, and $50, respectively, if the rainfall is low, medium, or high. If the farmer decides to plant soybeans, the yield per acre will be $40, $70, and $20, respectively, for low, medium, and high amounts of rainfall.
As shown in the figure, the decision to be made is whether the farmer should plant corn, soybeans, or nothing at all. There are three lines coming out of the decision box to indicate the three choices. Each choice leads to a probabilistic occurrence - how much rainfall will occur.
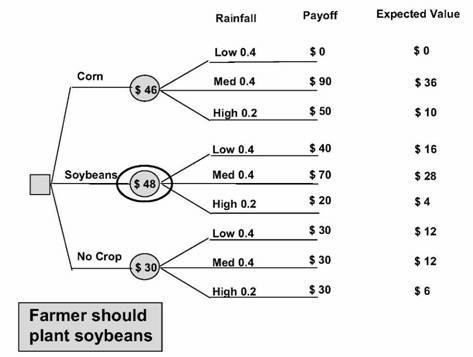
Each probabilistic occurrence has three possible outcomes - low, medium, or high amounts of rainfall. For each of these events there is an associated payoff. The payoff amount multiplied by the probability of that event occurring is the expected value of each occurrence.
In order to evaluate the decisions, we must add the expected value of each event associated with each decision to get the expected value for each decision. For corn, low rainfall means that no money will be made from the crop. For medium rainfall there is a 40 percent chance and a $90 yield, giving an expected value of $36. For high rainfall there is not as much yield per acre at $50 and there is a 20 percent probability of that occurring. The expected value for high rainfall is thus $10 per acre. Adding the expected values for the events gives us the expected value for the decision. This is $46 per acre.
Using the same calculation for the soybeans and for not planting at all, we see that of the three decisions, planting soybeans has the greatest yield.
User Contributed Comments 6
| User | Comment |
|---|---|
| jackwez | an easy way to remember this is the fact that A|B is like A/B multipled by B equals A.... along the same lines as teh dupont questions... |
| wundac | thanks jack |
| mdejesus | Man... I can't remember these formulas at all. But I CAN make a mean tree diagram. Making a tree diagram seems to be more helpful for me :) |
| choas69 | but u cant keep making trees in an exam bro |
| gyee2012 | Realize the change in mutliplication between independent and dependent probability and you will be set |
| Micheal11 | The theory part is really hard to memorise, but look at the example. Even without understanding the theory, it is so immediate. Well done AnalystNotes! |

Thanks again for your wonderful site ... it definitely made the difference.

Craig Baugh
My Own Flashcard
No flashcard found. Add a private flashcard for the subject.
Add