- CFA Exams
- 2026 Level I
- Topic 4. Financial Statement Analysis
- Learning Module 11. Financial Analysis Techniques
- Subject 5. Profitability Ratios
Seeing is believing!
Before you order, simply sign up for a free user account and in seconds you'll be experiencing the best in CFA exam preparation.
Subject 5. Profitability Ratios PDF Download
Profitability ratios measure the ability of a company to generate profits from revenue and assets.
Return on Sales
Net profit margin and gross profit margin are discussed in Topic [Analyzing Income Statements].
Operating profit margin relates a company's operating income to its net sales.
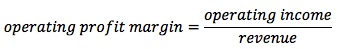
Operating profit, also known as earnings before Interest and Taxes (EBIT), is gross profit minus sales, general and administrative expenses (SG&A). It is profit before interest and taxes. The variability of this ratio over time is a prime indicator of the business risk of a company.
Pre-tax margin: EBT (earnings before tax but after interest)/revenue
It reflects the effect on the profitability of leverage and other non-operating income and expenses.
Since profit margin is valuable as a predictor of future earnings, an analyst needs to decide whether to back out other items, such as restructuring charges, in determining what represents income from "continuing" operations. These non-recurring items are considered part of continuing operations but may not be the best predictor of future earnings. Given the current problems in financial reporting, analysts should consider whether certain income statement items should be added/deleted from net income to obtain a better indicator of future earnings. In addition, any "quality of earnings" items should be considered, as should their potential effect on these operating performance ratios. For example, if a company decreased its bad debt expense calculation, it would improve the current year's net income but this might result in a larger expense being recorded in subsequent years. Analysts should be prepared to answer numerous ratio questions based on quality of earnings issues and their effects on ratios.
Return on Investment
The following ratios measure the percentage returns on capital employed.
Operating ROA = operating income/average total assets
Interpretation: this measures the return (before deducting interest on debt capital) that is earned by a company on its assets.
ROA measures the return earned by a company on its assets.
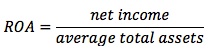
The problem is that net income is the return to equity-holders, whereas assets are financed by both equity-holders and creditors.
Return on total capital indicates a company's return on all the capital employed (debt, preferred stock, and common stock). It measures return on all sources of funding.
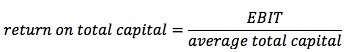
where total capital = debt + equity.
This ratio should match the perceived risk of the company. A return well below the industry norm shows the company is losing its competitiveness within the industry.
ROE (Return on equity) measures return on total equity capital only. This includes both preferred and common equity owners.
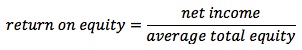
Return on common equity is also a useful indicator. This ratio is:
This ratio reflects the financial risk assumed by the common stockholder.
Integrated Financial Ratio Analysis
Ratios can also be combined and evaluated as a group to better understand how they fit together and how efficiency and leverage are tied to profitability. The information from one ratio category can be helpful in answering questions raised by another category. The most accurate overall picture comes from integrating information from all sources. Please refer to the textbook for examples.
User Contributed Comments 0
You need to log in first to add your comment.

I used your notes and passed ... highly recommended!

Lauren
My Own Flashcard
No flashcard found. Add a private flashcard for the subject.
Add