- CFA Exams
- 2026 Level I
- Topic 1. Quantitative Methods
- Learning Module 8. Hypothesis Testing
- Subject 9. Tests Concerning Differences between Means with Dependent Samples
Why should I choose AnalystNotes?
AnalystNotes specializes in helping candidates pass. Period.
Subject 9. Tests Concerning Differences between Means with Dependent Samples PDF Download
In the previous subject, t-tests were examined to discern differences between two population means. There were two separate populations which were independent of each other.
In this subject, the focus will be on conducting a test based on the means of samples that are related in some way. The data are arranged in paired observations; the test is sometimes known as a paired comparisons test. The paired observations are either in or not in the same units.
This test is normally used in two cases:
- a before-and-after situation, where analysts compare data before and after a certain process/procedure/treatment has taken place.
- when there is a relationship between the values, for example, collecting data from twins.
In both cases, the data in each pair of observations are dependent.
This method involves forming differences by subtracting one value of the pair from the other. The sample is then reduced to a single sample and the test statistic is based on the values of the differences.
In this situation, use the subscript d to indicate the differences being dealt with.
The hypotheses are therefore:
- H0: μd = μd0
- Ha: μd ≠ μd0
where μd0 is some fixed value, commonly zero, about which you are hypothesizing.
The test statistic is then:

where d-bar and sd-bar are calculated from the sample of differences in the usual way.
Thus,
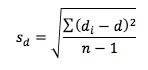 and
and 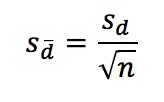
Also, because the sample has been reduced to a single sample of size n, the test statistic has n-1 degrees of freedom.
Example
A program that is believed to improve I.Q. levels has been offered to primary school children. I.Q. levels are believed to be normally distributed. A group of 100 children participated in the program. The mean difference in their I.Q. levels (after minus before) was found to be 2, with a standard deviation of 11. Test whether the program is effective at the 5% significance level.
This is clearly a paired comparisons test, as you are given a before-and-after situation. Note also that you are told that the population is normally distributed. However, since the sample size is so large (n =100), this fact is academic, because the central limit theorem states that the sample mean will be normally distributed in any case. (This is just a point for you to take note of.)
Step 1: State the hypotheses.
Although it is perfectly acceptable to work with differences as before-minus-after, you will take the more conventional approach of after-minus-before, because this is how the data are presented.
Note also that you wish to test whether the program is effective, that is, whether I.Q. levels increase after the program. You therefore have a "greater than" test. Under H0, assume that the program is not effective, so the value of μd0 = 0.
The hypotheses are therefore - H0: μd = 0 versus Ha: μd > 0.
Step 2: Identify the test statistic and its probability distribution.
The population is normally distributed and you are dealing with paired comparisons, so a paired comparisons t-test is appropriate here.
Step 3: Specify the significance level.
You are told to test at the 5% level, so α= 0.05.
Step 4: State the decision rule.
This is a greater-than test, so the full 5% of the area goes in the right tail. Also, the degrees of freedom are: n-1 = 99. The tables don't have 99 degrees of freedom, so use 100, which is the closest value to 99. From the t-table, the critical value is therefore 1.66.
The value above determines your decision. If your test statistic lies to the right of 1.66, you will reject H0; otherwise, you will not reject H0.
You might notice that the critical value of 1.66 is very close to the corresponding z-value of 1.645. This is because, as explained earlier, as the degrees of freedom increase, so the t-values approach the z-values. Since 100 degrees of freedom is a large number, the t-graph here closely resembles a z-graph.
Step 5: Collect the data in the sample and calculate the necessary value(s) using the sample data.
The question gives you the necessary sample values: d-bar = 2, sd-bar = 11 and n = 100.
The test statistic is: t = (2 - 0)/(11/1001/2) = 1.818.
Note that μd0 is the value of μd under H0, and is thus zero.
The t-value of 1.818 is now compared with your critical value of 1.66.
Step 6: Make a decision regarding the hypotheses.
Since the value of the test statistic is more extreme (i.e., further away from zero) than the critical value, you see that the test statistic falls in the rejection region. You would thus reject H0 at the 5% significance level.
Step 7: Make a decision based on the test results.
You can now conclude that the program is effective in increasing I.Q. levels at the 5% significance level.
Note:
- Had a p-value approach been used here, a p-value between 0.025 and 0.05 would have been obtained. (You can check this for yourself as an exercise.) You cannot obtain the p-value exactly from t-tables. Because this value is smaller than 0.05, you would reject H0, so your results are consistent with the above.
- Had you worked with before-minus-after, then the value would have been -2, and our test statistic would have been -1.818. Your alternative hypothesis would then have needed to be <, as you are testing whether levels before are smaller than levels after. The critical value would then have been -1.66 and you would still have landed in the rejection region, making no difference to your conclusion. However, doing the test this way seems less logical than the method used above. Either works, though, with the correct modification.
The key issue now is that you understand when to use a test for independence and when to use a paired comparisons test.
To help clarify the issue for you:
- A test of the differences in means (as conducted in subject i) is used when there are two independent samples. Essentially, you have two separate groups, and you wish to compare their population means.
- A test of the mean of the difference (as conducted in subject j) is used when the samples are dependent, either because you have a before-and-after situation or because there is an inherent relation between the pairs.
In the first case, you keep the groups completely separate and combine their sample sizes for the purpose of calculating degrees of freedom.
In the second case, you reduce the two samples to a single sample of differences and treat the entire process from then on as if you were dealing with a single sample.
Another telltale sign is to look at sample sizes. If the sample sizes are different, the test has to be for independent samples, as paired comparisons tests require equal-sized samples. If the sample sizes are the same, either test could be used.
What the two procedures have in common is that they both require normally distributed populations and they both make use of t-tests.
Until now, the examples have been testing means of populations, and have made use of z-tests and t-tests. Now it's time to look at the procedure for testing variances of populations and to introduce two new statistical distributions: the chi-square distribution and the F-distribution.
User Contributed Comments 2
| User | Comment |
|---|---|
| sanyukta | In the example, if s_d-bar is 11 already, shouldn't the test statistics be (2-0)/11 = 1.82%? if, as shown about, test statistics is (2-0)/(11/100^0.5), then 11 should be s_d instead of s_d-bar? |
| w12122333 | I have the same question as sanyukta! |

I was very pleased with your notes and question bank. I especially like the mock exams because it helped to pull everything together.

Martin Rockenfeldt
My Own Flashcard
No flashcard found. Add a private flashcard for the subject.
Add