- CFA Exams
- 2026 Level I
- Topic 9. Portfolio Management
- Learning Module 2. Portfolio Risk and Return: Part II
- Subject 5. The Capital Asset Pricing Model
Why should I choose AnalystNotes?
Simply put: AnalystNotes offers the best value and the best product available to help you pass your exams.
Subject 5. The Capital Asset Pricing Model PDF Download
Assumptions of the CAPM
The assumptions of the CAPM include:
All investors are Markowitz efficient investors who want to target points on the efficient frontier where their utility maps are tangent to the line. The exact location on the efficient frontier and, therefore, the specific portfolio selected, will depend on the individual investor's risk-return utility function.
Markets are frictionless. There are no taxes or transaction costs involved in buying or selling assets. Investors can borrow and lend any amount of money at the risk-free rate of return.
All investors have the same one-period time horizon (e.g., one year).
All investors have homogeneous expectations: that is, they estimate identical probability distributions for future rates of return.
All investments are infinitely divisible, which means that it is possible to buy or sell fractional shares of any asset or portfolio.
All investors are price takers. Their trades cannot affect security prices.
The CAPM
Capital market theory builds on portfolio theory. CAPM refers to the capital asset pricing model. It is used to determine the required rate of return for any risky asset.
In the discussion about the Markowitz efficient frontier, the assumptions are:
- Investors have examined the set of risky assets and identified the efficient frontier.
- Every investor will choose the optimal portfolio of risky assets on the efficient frontier. The optimal portfolio lies at the point where the highest indifference curve is tangent to the efficient frontier.
The CAPM uses the SML or security market line to compare the relationship between risk and return. Unlike the CML, which uses standard deviation as a risk measure on the X axis, the SML uses the market beta, or the relationship between a security and the marketplace.
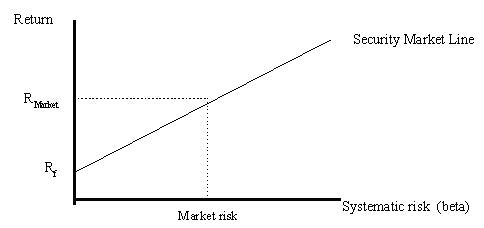
The use of beta enables an investor to compare the relationship between a single security and the market return rather than a single security with each and every other security (as Markowitz did). Consequently, the risk added to a market portfolio (or a fully diversified set of securities) should be reflected in the security's beta. The expected return for a security in a fully diversified portfolio should be:
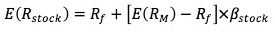
E(RM) - Rf is the market risk premium, while the risk premium of the security is calculated by β[E(RM) - Rf].
Note that the "expected" and the "required" returns mean the same thing. The expected return based on the CAPM is exactly the return an investor requires on the security.
- To compute the required rate of return: .
- To compute the expected rate of return of an individual security, you need to use forecasted future security price and dividend: R = (Future price - current price + dividend) / Current price.
The SML represents the required rate of return, given the systematic risk provided by the security. If the expected rate of return exceeds this amount, then the security provides an investment opportunity for the investor. The difference between the expected and required return is called the alpha (α) or excess rate of return. The alpha can be positive when a stock is undervalued (it lies above the SML) or negative when the stock is overvalued (it falls below the SML). The alpha becomes zero when the stock falls directly on the SML (properly valued).
Security Market Line vs. Capital Market Line:
- The CML examines the expected returns on efficient portfolios and their total risk (measured by standard deviation). The SML examines the expected returns on individual assets and their systematic risk (measured by beta). If the relationship between expected return and beta is valid for any individual securities, it must also be valid for portfolios constructed with any of these securities. So, the SML is valid for both efficient portfolios and individual assets.
- The CML is the graph of the efficient frontier and the SML is the graph of the CAPM.
- The slope of the CML is the market portfolio's Sharpe ratio and the slope of the SML is the market risk premium.
- All properly priced securities and efficient portfolios lie on the SML. However, only efficient portfolios lie on the CML.
Portfolio Beta. The β of a portfolio is the weighted sum of the individual asset betas. For example, if 40% of the money is in stock A with a β of 2.0 and 60% of the money is in stock B with a β of 0.8, the portfolio β is 0.4 x 2.0 + 0.6 x 0.8 = 1.28.
User Contributed Comments 9
| User | Comment |
|---|---|
| teddajr | Very Important Topic for review. |
| thekapila | indeed! |
| Farina | Yeah, these premises are the cornerstone of most successful value investing strategy. Rumour has it that the trigger for a Buffet/Berkshire Hathaway purchas is an SML undervaluation of 40%, which would explain why they have such strong long term returns. |
| gazza77 | i think they've written the formula wrong in the first paragraph says Cov(m,m)= var(m)???? obviously Cov(m,m)=1? |
| soorajiyer | Well explained, thanks! |
| cfatime21 | Great summary at the bottom... |
| Naoual | @Gazza Cov(i,m)=Corr(i,m)xSTixSTm substituate i by m, and you get: Cov(m,m)=1xSTmxSTm=Var(m) 1 is the correlation. |
| gill15 | Agree with CFAtime. Amazing summary at end. I would`ve spent a couple hours wasting time figuring out what the differences were without that. |
| Corey678 | Expected Return(stock) equation very similar to BDY minus the time aspect. |

I am using your study notes and I know of at least 5 other friends of mine who used it and passed the exam last Dec. Keep up your great work!

Barnes
My Own Flashcard
No flashcard found. Add a private flashcard for the subject.
Add