- CFA Exams
- 2026 Level II
- Topic 6. Fixed Income
- Learning Module 26. The Term Structure and Interest Rate Dynamics
- Subject 5. Yield Curve Factor Models
Why should I choose AnalystNotes?
Simply put: AnalystNotes offers the best value and the best product available to help you pass your exams.
Subject 5. Yield Curve Factor Models PDF Download
The shape of the yield curve changes continuously, causing a bond's price to change. The yield curve risk, or the shaping risk, measures the sensitivity of a bond's price to the changing shape of the yield curve. On the other hand, the interest rate risk is the sensitivity of a bond to parallel shifts of the yield curve.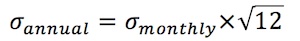
Historical yield curve movements suggest that they can be explained by a linear combination of three principal movements:
- The level movement can explain 77% to 80% of the total variance. The implication is that the most important factor a fixed-income portfolio manager should control for is exposure to changes in the level of interest rates. Duration is the measure used to quantify exposure to a parallel shift in the yield curve.
- The steepness movement can explain 10 - 17%.
- The curvature movement can explain another 3% of the total variance.
The Maturity Structure of Yield Curve Volatilities
The volatility term structure is a representation of the yield volatility of a zero-coupon bond for every maturity of security. It can be measured using historical data and depicts yield curve risk.
Volatility is measured in terms of the standard deviation or variance. For example, if you have monthly yield data for a 3-month T-Bill, you can calculate its monthly standard deviation of yields, and then annualize the standard deviation:
Typically the bond that trades at a lower yield is more volatile. For a given change in interest rates, price sensitivity is lower when the level of interest rates in the market is high, and price sensitivity is higher when the level of interest rates is low.
Managing Yield Curve Risk
Effective duration would not do a good job in measuring yield curve risk because it assumes a small parallel shift of the curve. A better measure would be key rate duration.
In this approach, analysts calculate the sensitivity of the bond's price to changes in several key rates, such as 1-year, 2-year, 5-year and 10-year rates. An important assumption is that when one of the key rates is shocked, all other key rates remain constant.
Several key rate durations result from this approach, one for each key rate.
- Every security in a portfolio has a set of key rate durations.
- Each key rate duration of a portfolio is the weighted average of key rate durations of individual securities.
- The sum of all key rate durations for a portfolio or an individual security is equal to the effective duration of this portfolio or asset.
Example
Suppose there are four key rates (2-years, 10 years, 20 years and 30 years). The effective duration of a zero-coupon bond is the number of years to maturity. Therefore, the four key rate durations are 2, 10, 20 and 30. Consider the following portfolio:
D1: key rate duration for the 2-year part of the curve. D2, D3, D4 ... All bonds are zero coupon bonds.
Let's calculate the 10-year duration of the portfolio. The duration of each zero-coupon bond equals its maturity. The 10-year key rate duration of the portfolio equals the product of 10-year zero's duration (which is 10) and the weight of this bond in the portfolio (40%). Therefore, the 10-year key rate duration of the portfolio is 10 x 0.4 = 4.
To calculate the effective duration of the portfolio, we simply sum all its key rate durations 0.4 + 4 + 5 + 4.5 = 13.9.
Now we will interpreting key rate duration. Suppose the yield curve shifts so that:
- 2-year rates decrease by 50 bp.
- 10-year rates decrease by 120 bp.
- 20-year rates decrease 100 bp.
- 30-year rates increase by 50 bp.
Change in portfolio value:
- 2-year: -(-0.5%)(0.4) = 0.2% increase.
- 10-year: -(-1.2%)(4) = 4.8% increase.
- 20-year: -(-1%)(5) = 5.0% increase.
- 30-year: -(0.5%)(4.5) = -2.25% decrease.
- Total = 7.75% increase.
User Contributed Comments 2
| User | Comment |
|---|---|
| ryanpetty | When the yield curve changes, the price of the bond, which was initially priced based on the initial yield curve, will change in price. For example, if the yield curve flattens, then the yield spread between long- and short-term interest rates narrows, and the price of the bond will change accordingly. If the bond is a short-term bond maturing in three years and the three-year yield decreases, the price of this bond will increase. If the yield curve steepens, this means that the spread between long- and short-term interest rates increases. Therefore, long-term bond prices will decrease relative to short-term bonds. Changes in the yield curve are based on bond risk premiums and expectations of future interest rates. |
| thebkr777 | You are the man |

You have a wonderful website and definitely should take some credit for your members' outstanding grades.

Colin Sampaleanu
My Own Flashcard
No flashcard found. Add a private flashcard for the subject.
Add