- CFA Exams
- 2023 Level I > Topic 1. Quantitative Methods > Reading 5. Sampling and Estimation
- 5. Confidence Intervals for the Population Mean and Selection of Sample Size
Seeing is believing!
Before you order, simply sign up for a free user account and in seconds you'll be experiencing the best in CFA exam preparation.
Subject 5. Confidence Intervals for the Population Mean and Selection of Sample Size
- The point estimate is the value of a sample statistic of the population parameter.
- The reliability factor is a number based on the sampling distribution of the point estimate and the degree of confidence (1 - α).
- Standard error refers to the standard error of the sample statistic that is used to produce the point estimate.
Whatever the distribution of the population, the sample mean is always the point estimate used to construct the confidence intervals for the population mean. The reliability factor and the standard error, however, may vary depending on three factors:
- Distribution of population: normal or non-normal
- Population variance: known or unknown
- Sample size: large or small
z-Statistic: a standard normal random variable
If a population is normally distributed with a known variance, a z-statistic is used as the reliability factor to construct confidence intervals for the population mean.
In practice, the population standard deviation is rarely known. However, learning how to compute a confidence interval when the standard deviation is known is an excellent introduction to how to compute a confidence interval when the standard deviation has to be estimated.
Three values are used to construct a confidence interval for μ:
- the sample mean (m)
- the value of z (which depends on the level of confidence)
- the standard error of the mean (σ)m
The confidence interval has m for its center and extends a distance equal to the product of z and in both directions. Therefore, the formula for a confidence interval is:
For a (1 - α)% confidence interval for the population mean, the z-statistic to be used is zα/2. zα/2 denotes the points of the standard normal distribution such that α/2 of the probability falls in the right-hand tail.
Effectively, what is happening is that the (1 - α)% of the area that makes up the confidence interval falls in the center of the graph, that is, symmetrically around the mean. This leaves α% of the area in both tails, or α/2 % of area in each tail.
Commonly used reliability factors are as follows:
- 90% confidence intervals: z0.05 = 1.645. α is 10%, with 5% in each tail
- 95% confidence intervals: z0.025 = 1.96. α is 5%, with 2.5% in each tail
- 99% confidence intervals: z0.005 = 2.575. α is 1%, with 0.5% in each tail
Example
Assume that the standard deviation of SAT verbal scores in a school system is known to be 100. A researcher wishes to estimate the mean SAT score and compute a 95% confidence interval from a random sample of 10 scores.
The 10 scores are: 320, 380, 400, 420, 500, 520, 600, 660, 720, and 780. Therefore, m = 530, N = 10, and σm= 100 / 101/2 = 31.62. The value of z for the 95% confidence interval is the number of standard deviations one must go from the mean (in both directions) to contain .95 of the scores.
It turns out that one must go 1.96 standard deviations from the mean in both directions to contain .95 of the scores. The value of 1.96 was found using a z table. Since each tail is to contain .025 of the scores, you find the value of z for which 1 - 0.025 = 0.975 of the scores are below. This value is 1.96.
All the components of the confidence interval are now known: m = 530, σm = 31.62, z = 1.96.
Lower limit = 530 - (1.96)(31.62) = 468.02
Upper limit = 530 + (1.96)(31.62) = 591.98
Therefore, 468.02 ≤ μ ≤ 591.98. This means that the experimenter can be 95% certain that the mean SAT in the school system is between 468 and 592. This also means if the experimenter repeatedly took samples from the population and calculated a number of different 95% confidence intervals using the sample information, on average 95% of those intervals would contain μ. Notice that this is a rather large range of scores. Naturally, if a larger sample size had been used, the range of scores would have been smaller.
The computation of the 99% confidence interval is exactly the same except that 2.58 rather than 1.96 is used for z. The 99% confidence interval is: 448.54 <= μ <= 611.46. As it must be, the 99% confidence interval is even wider than the 95% confidence interval.
Summary of Computations
- Compute m = ∑X/N
- Compute σm = σ/N1/2
- Find z (1.96 for 95% interval; 2.58 for 99% interval)
- Lower limit = m - z σm
- Upper limit = m + z σm
- Lower limit <= μ <= Upper limit
Assumptions:
- Normal distribution
- σ is known
- Scores are sampled randomly and are independent
There are three other points worth mentioning here:
- The point estimate will always lie exactly at the midway mark of the confidence interval. This is because it is the "best" estimate for μ, and so the confidence interval expands out from it in both directions.
- The higher the percentage of confidence, the wider the interval will be. As the percentage is increased, a wider interval is needed to give us a greater chance of capturing the unknown population value within that interval.
- The width of the confidence interval is always twice the part after the positive or negative sign, that is, twice the reliability factor x standard error. The width is simply the upper limit minus the lower limit.
It is very rare for a researcher wishing to estimate the mean of a population to already know its standard deviation. Therefore, the construction of a confidence interval almost always involves the estimation of both μ and σ.
Students' t-Distribution
When σ is known, the formula m - z σm <= μ <= m + z σm is used for a confidence interval. When σ is not known, σm = s/N1/2 (N is the sample size) is used as an estimate of σ and μ. Whenever the standard deviation is estimated, the t rather than the normal (z) distribution should be used. The values of t are larger than the values of z, so confidence intervals when σ is estimated are wider than confidence intervals when σ is known. The formula for a confidence interval for μ when σ is estimated is:
where m is the sample mean, sm is an estimate of σm, and t depends on the degrees of freedom and the level of confidence.
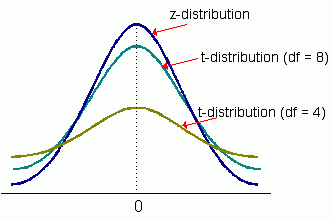
The t-distribution is a symmetrical probability distribution defined by a single parameter known as degrees of freedom (df). Each value for the number of degrees of freedom defines one distribution in this family of distributions. Like a standard normal distribution (e.g., a z-distribution), the t-distribution is symmetrical around its mean. Unlike a standard normal distribution, the t-distribution has the following unique characteristics.
- It is an estimated standardized normal distribution. When n gets larger, t approximates z (s approaches σ).
- The mean is 0 and the distribution is bell-shaped.
- There is not one t-distribution, but a family of t-distributions. All t-distributions have the same mean of 0. Standard deviations of these t-distributions differ according to the sample size, n.
- The shape of the distribution depends on degrees of freedom (n - 1). The t-distribution is less peaked than a standard normal distribution and has fatter tails (i.e., more probability in the tails).
- tα/2 tends to be greater than zα/2 for a given level of significance, α.
- Its variance is v/(v-2) (for v > 2), where v = n-1. It is always larger than 1. As v increases, the variance approaches 1.
The value of t can be determined from a t-table. The degrees of freedom for t are equal to the degrees of freedom for the estimate of σm, which is equal to N-1.
A portion of a t-table is presented below:
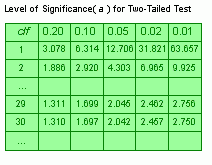
Suppose the sample size (n) is 30 and the level of significance (α) is 5%. df = n - 1 = 29. tα/2 = t0.025 = 2.045 (Find the 29 df row, and then move to the 0.05 column.)
Example
Assume a researcher is interested in estimating the mean reading speed (number of words per minute) of high school graduates and computing the 95% confidence interval. A sample of 6 graduates was taken; reading speeds were: 200, 240, 300, 410, 450, and 600. For these data,
- m = 366.6667
- sm = 60.9736
- df = 6-1 = 5
- t = 2.571
Therefore, the lower limit is: m - (t) (sm) = 209.904 and the upper limit is: m + (t) (sm) = 523.430. Therefore, the 95% confidence interval is: 209.904 <= μ <= 523.430.
Thus, the researcher can be 95% sure that the mean reading speed of high school graduates is between 209.904 and 523.430.
Summary of Computations
- Compute m = ∑X/N
- Compute s
- Compute σm = s/N1/2
- Compute df = N-1
- Find t for these df using a t table
- Lower limit = m - t sm
- Upper limit = m + t sm
- Lower limit <= μ <= Upper limit
Assumptions:
- Normal distribution
- Scores are sampled randomly and are independent.
Discuss the issues surrounding selection of the appropriate sample size
It's all starting to become a little confusing. Which distribution do you use?
When a large sample size (generally larger than 30 samples) is used, a z-table can always be used to construct the confidence interval. It does not matter if the population distribution is normal or if the population variance is known. This is because the central limit theorem assures us that when the sample is large, the distribution of the sample mean is approximately normal. However, the t-statistic is more conservative because it tends to be greater than the z-statistic; therefore, using a t-statistic will result in a wider confidence interval.
If there is only a small sample size, a t-table has to be used to construct the confidence interval when the population distribution is normal and the population variance is not known.
If the population distribution is not normal, there is no way to construct a confidence interval from a small sample (even if the population variance is known).
Therefore, if all other factors are equal, you should try to select a sample larger than 30. The larger the sample size, the more precise the confidence interval.
In general, at least one of the following is needed:
- a normal distribution for the population
- a sample size that is greater than or equal to 30
If one or both of the above occur, a z-table or t-table is used, dependent upon whether σ is known or unknown. If neither of the above occurs, then the question cannot be answered.
A summary of the situation is as follows:
- If the population is normally distributed and the population variance is known, use a z-score (irrespective of sample size).
- If the population is normally distributed and the population variance is unknown, use a t-score (irrespective of sample size).
- If the population is not normally distributed, and the population variance is known, use a z-score only if n >= 30; otherwise, it cannot be calculated.
- If the population is not normally distributed and the population variance is unknown, use a t-score only if n >= 30; otherwise, it cannot be calculated.
Practice Question 1
When constructing confidence intervals for a normally distributed population, the t-distribution is used when ______A. the population standard deviation is known.
B. the sample size is less than 30, regardless of the population standard deviation.
C. the population standard deviation is unknown and the sample size is less than 30.Correct Answer: C
The t-distribution is used to compensate for σ being unknown and small sample size.
Practice Question 2
You are thinking of using a t procedure to construct a 95% confidence interval for the mean of a population. You suspect that the distribution of the population is not normal and may be skewed. Which of the following statements is correct?A. You should not use the t procedure because the population does not have a normal distribution.
B. You may use the t procedure, provided your sample size is large, say, at least 30.
C. You may use the t- procedure because it is robust to non-normality.Correct Answer: B
t procedures are robust against non-normality of the population except in the case of outliers or strong skewness. Guidelines are:
- sample size less than 15: use a t procedure if the data are close to normal. If the data are clearly not normal or if outliers are present, do not use a t procedure.
- sample size at least 15: a t procedure can be used except in the presence of outliers or strong skewness.
- large samples: t procedures can be used even for clearly skewed distributions when the sample is large, roughly n >= 30.
Practice Question 3
What assumption is made when calculating a confidence interval around the mean for a sample with less than 30 data points?I. The sample is normally distributed.
II. The population from which the sample was taken is normally distributed.
III. The sample standard deviation is equal to the population standard deviation.Correct Answer: II
Practice Question 4
t-distributions are spread out ______ (more or less) than a normal distribution with μ = 0, σ = 1.Correct Answer: morePractice Question 5
A t-distribution with 30 d.f. is most similar to a ______ distribution.A. normal distribution with μ = 1 and σ2 = 1
B. normal distribution with μ = 0 and σ2 = 29
C. normal distribution with μ = 0 and σ2 = 1Correct Answer: C
Practice Question 6
Crop researchers plant 100 plots with a new variety of corn. The average yield for these plots is x-bar = 130 bushels per acre. Assume that the yield per acre for the new variety of corn follows a normal distribution with unknown mean μ and standard deviation σ = 10 bushels per acre. A 90% confidence interval for μ is ______.Correct Answer: 130 ± 1.645Recall that a confidence interval for the mean μ of a normal distribution with standard deviation σ is x-bar ± zσ/n1/2.
Here x-bar = 130, n = 100, σ = 10 and z = 1.645, so our interval is 130 ± 1.645.
Practice Question 7
To assess the accuracy of a kitchen scale, a standard weight that is known to weigh 1 gram is repeatedly weighed a total of n times and the mean x-bar of the weighing is computed. Suppose the scale readings are normally distributed with unknown mean μ and standard deviation σ = 0.01 g. How large should n be so that a 90% confidence interval for μ has a margin of error of 0.0001?Correct Answer: 27,060.25Since n = [z x σ/m]2, where z = 1.645, σ = 0.01 and m = 0.0001, n = 27,060.25.
Practice Question 8
For a random sample of size n = 100 from a population with s = 8, the error term, E, for a 90% confidence interval is ______ (to nearest 0.01).A. 0.05
B. 1.32
C. 10Correct Answer: B
For a 90% confidence interval, we find z(0.05), the cutoff for the top 5% of the normal distribution. Looking up 0.95 in the middle of the table, the reading to the row/column values, we get 1.645. Working with the formula for E, we get E = 1.32.

Practice Question 9
If a random sample of size n = 100 from a population with s = 8 yields a sample mean of 56, then a 90% confidence interval for μ is ______.A. -1.32 < μ < 1.32
B. 54.98 < μ < 57.02
C. 54.68 < μ < 57.32Correct Answer: C
For a 90% confidence interval we find z(0.05), the cutoff for the top 5% of the normal distribution. Looking up 0.95 in the middle of the table, the reading to the row/column values, we get 1.645. Working with the formula for E, we get E = 1.32. So, the 90% confidence interval is 56 - 1.32 < m < 56 + 1.32 or 54.68 < μ < 57.32.
Practice Question 10
To estimate the average number of miles tires at RoadStar will last, a random sample of 64 tires is tested. If the sample mean produced is 35,000 miles and the population standard deviation is 5000 miles, then a 90% confidence interval is ______.A. 30,000 < m < 40,000
B. 26,775 < m < 43,225
C. 33,972 < m < 36,028Correct Answer: C
For a 90% confidence interval, we find z(0.05), the cutoff for the top 5% of the normal distribution. Looking up 0.95 in the middle of the table, the reading to the row/column values, we get 1.645. Working with the formula for E (see top right) we get E = 1028. So, the 90% confidence interval is 35.000 - 1028 < m < 35,000 + 1028 or 33,972 < m < 36,028.
Practice Question 11
To estimate the average length of their employee's telephone calls to within 0.1 minutes at a 90% confidence level, FoneJack, Inc. must randomly sample how many employee phone calls? (The population can be assumed normal with a standard deviation of 0.8 minutes.)A. 169
B. 14
C. 174Correct Answer: C
We work with the formula for E, solving it for n, the sample size. First, a 90% level of confidence; we need z(0.05). Going to the normal table, we get z(0.05) = 1.645. Now, working with the E formula, we get n = 173.1856. So, the sample size needed is n = 174 (if there is a decimal part, we always go to the next whole number).

Practice Question 12
For a 90% confidence interval for the population proportion, p, if the sample proportion, p', is 0.4 and the sample size is n = 100 then the error term, E, is ______ (to the nearest 0.001).
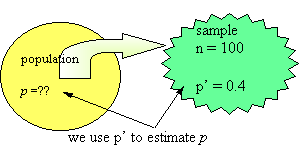
A. 0.049
B. 0.004
C. 0.081Correct Answer: C
The error term is some number of standard deviations, in this case, 1.645 (the cutoff for the top 5% of the normal distribution). The standard deviation of the sampling distribution is sqrt[(0.4)(1 - 0.4)/100] = 0.049. Now, E = 1.64(0.049) = 0.081. Thus, the confidence interval for p is 0.4 - 0.081 < p < 0.4 + 0.081.

Practice Question 13
In estimating the population proportion for the days in summer that have thunderstorms, p, if the sample proportion, p', is 0.35 and the sample size is n = 92, the standard deviation of the sampling distribution is ______ (to nearest 0.001).A. 0.650
B. 0.350
C. 0.050Correct Answer: C
For a proportion the standard deviation of the sampling distribution, the distribution of the p's is shown at top right. Working with this formula, we get 0.050.

Practice Question 14
A local college wants to find the percentage of students with access to the Internet. At a 95% level of confidence, how large of a sample would be needed to estimate the percentage to within 3 percentage points?A. 1068
B. 1849
C. 33Correct Answer: A
Because we know nothing about the situation and have no estimate of p', we use p' = 0.5. Working with the formula for E, the error term, we get n = 1068. Thus, we need a sample size of n = 1,068 students.

Practice Question 15
A 95% confidence interval for a population mean will be ______ a 99% confidence interval for the same population mean. (Both calculations are based on the same set of data.)A. longer than
B. shorter than
C. the same length as
D. It depends on the particular set of dataCorrect Answer: B
When the data set is the same, the length of the confidence interval depends on the z- or t-value used. This value is smaller for 95% confidence than for 99% confidence, so it will result in a smaller interval.
Practice Question 16
100 items are sampled from a normal distribution. The sample mean is 10 and the sample standard deviation is 2; a 95% confidence interval for the sample mean must lie between ______.A. 9.608 and 10.392
B. 9.324 and 10.676
C. 9.108 and 10.892Correct Answer: A
Practice Question 17
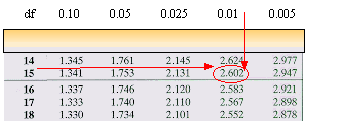
For the t-distribution, if a = 0.01 and n = 16, the t-value is ______.A. 2.583
B. 2.602
C. 1.341Correct Answer: B
Reading the t-table, we go to column 0.01 then down to row 16 - 1 or row 15. The value is 2.602.
Practice Question 18
For a normal population with s unknown, a sample of size n = 12 yields a sample mean of 54 and a sample standard deviation of 6. At a 95% confidence level, the error term E is ______ (to nearest 0.01).A. 3.77
B. 3.39
C. 3.81Correct Answer: C
Because s is unknown, we use the t-distribution. We work with E as shown below. The a level is 0.05/2 = 0.025 and the degrees of freedom is 12 - 1 or 11. The table value is 2.201.

Practice Question 19
For a normal population with s unknown, a sample of size n = 21 yields a sample mean of 32 and a sample standard deviation of 3. At a 90% confidence interval for m is ______ (to nearest 0.01).A. 31.13 < m < 32.87
B. 30.35 < m < 33.65
C. 30.87 < m < 33.13Correct Answer: C
Because s is unknown we use the t-distribution. We work with E as shown below. The a level is 0.1/2 = 0.05 and the degrees of freedom is 21 - 1 or 20. The table value is 1.725. E is 1.13 and the confidence interval is 30.87 < m < 33.13.

Practice Question 20
As sample size increases, ______A. critical values for t decrease.
B. degrees of freedom decrease.
C. confidence interval width increases.Correct Answer: A
As sample size increases, degrees of freedom increase and critical values for t decrease. Thus, the amount added to or subtracted from the sample mean to create the confidence interval will decrease. Therefore, confidence interval width will decrease.
Practice Question 21
True or False? If False, correct the statement.Confidence intervals can be shortened by increasing the sample size.Correct Answer: True
Other things being equal, the confidence interval will decrease as sample size increases.
Practice Question 22
Select the correct statement(s).I. The main difference between the t and z statistic is that the t statistic has a mean of 1 and the z statistic has a mean of 0.
II. The t-score is used when the sample size is 30 or more and you know the population standard deviation.
III. Increasing the confidence level while keeping other values constant will keep the width of the interval unchanged.Correct Answer: None of these statements is correct.
Practice Question 23
A portfolio with 10 stocks has a weighted average return of 5.5% and a variance of 25. What is the 85% confidence interval for the weighted average?A. [-35.625%, 46.625%]
B. [-30.5%, 41.5%]
C. [3.22%, 7.78%]Correct Answer: C
The variance is 25, which corresponds to a standard deviation of 5%. The 85% confidence interval is given by: X-bar +- 1.44s = 5.5 +- 1.44 x 5/10^0.5 = [3.22, 7.78]
Practice Question 24
A statistician is calculating a confidence interval but the standard deviation of the sampled population is unknown. It is acceptable to use the sample standard deviation in place of the population standard deviation when ______I. the sample distribution is normally distributed.
II. the sample size is greater than 30.
III. the sample distribution behaves according to the central limit theorem.
A. I and II
B. I and III
C. I, II and IIICorrect Answer: C
Practice Question 25
The main difference between the t and z statistic is that the t statistic ______.A. is not normally distributed like the z statistic
B. is more variable than the z statistic
C. is less variable than the z statisticCorrect Answer: B
Practice Question 26
A statistician has randomly selected 25 samples from a production line for testing. In order for this sample to be a valid indication of the population, what assumption about the sample is necessary?I. The population variance is equal to the population mean.
II. The population of paired differences must be normal.
III. The population must have a normal distribution.
A. III only
B. II and III
C. I and IIICorrect Answer: A
Practice Question 27
When finding a confidence interval for the population mean, when is t-score used as the critical value (assuming the population is normally distributed)?A. The sample size is less than 30 or you do not know the population standard deviation.
B. The sample size is 30 or more or you know the population standard deviation.
C. The sample size is less than 30 and you do not know the population standard deviation.Correct Answer: C
null
Practice Question 28
Which of the following is a true statement regarding the comparison of t-distributions to standard normal distributions?I. Normal distributions are symmetrical whereas t-distributions are slightly skewed.
II. The proportion of area beyond a specific value of t is less than the proportion of area beyond the corresponding value of z.
III. The greater the df, the more the t-distributions resemble the standard normal distribution.
A. III only
B. I and III
C. II and IIICorrect Answer: A
null
Practice Question 29
A client will move his investment account unless the portfolio manager earns at least a 10 percent rate of return on the account. The rate of return for the portfolio the portfolio manager has chosen has a normal probability distribution with an expected return of 19 percent and a standard deviation of 4.5 percent. What is the probability that the portfolio manager will keep this account?A. 0.950
B. 1.000
C. 0.975Correct Answer: C
As a rule of thumb, two standard deviations produce a 95% confidence level. Since this question presents a one-tailed test, the probability of falling below the expected value by two standard deviations is 2.5%.
Confidence interval = (19% - 10%)/4.5% = 2 standard deviations
The frequency of outcomes two standard deviations less than the expected return is 2.28%.
Hence, the probability of keeping the account = 1.0000 - 0.0228 = 0.9772, closest to 0.975.
Practice Question 30
To estimate the average cost of a food-shopping event, Delcore Inc. randomly sampled 100 shoppers and found a sample mean of $72. Assuming a population standard deviation of $5, a 99% confidence interval for average cost for the food-shopping event is ______.A. $70.71 < m < $73.29
B. $71.18 < m < $72.82
C. $59.12 < m < $84.88Correct Answer: A
For a 99% confidence interval, we find z(0.005), the cutoff for the top 0.5% of the normal distribution. Looking up 0.995 in the middle of the table, the reading to the row/column values, we get 2.575. Working with the formula for E, we get E = 1.29. So, the 99% confidence interval is $72 - 1.29 < m < $72 + 1.29 or $70.71 < m < $73.29.
Practice Question 31
To estimate the average length of their employees' telephone calls, FoneJack, Inc. randomly sampled 25 employee phone calls. If the sample mean was 1.3 minutes and the population can be assumed normal with a standard deviation of 0.3 minutes, a 90% confidence interval for the phone calls is ______.A. 1.2 < m < 1.4
B. 1.24 < m < 1.36
C. 1.18 < m < 1.42Correct Answer: A
For a 90% confidence interval, we find z(0.05), the cutoff for the top 5% of the normal distribution. Looking up 0.95 in the middle of the table, the reading to the row/column values, we get 1.645. Working with the formula for E (see top right), we get E = 0.1. So, the 90% confidence interval is 1.3 - 0.1 < m < 1.3 + 0.1 or 1.2 < m < 1.4.
Practice Question 32
To estimate the average weight of the red-crowned woodpecker to within 2 grams at a 95% confidence level, researchers must randomly sample how many red-crowned woodpeckers? (The population can be assumed normal with a standard deviation of 13 grams.)A. 282
B. 70
C. 163Correct Answer: C
We work with the formula for E, solving it for n, the sample size. First, for a 95% level of confidence, we need z(0.025). Going to the normal table, we get z(0.025) = 1.96. Now, working with the E formula, we get n = 162.3076. So, the sample size needed is n = 163 (if there is a decimal part, we always go to the next whole number).

Practice Question 33
If the number of days in a 92-day summer period in which a thunderstorm occurred is 28, then a 90% confidence interval for the percentage of days in summer that have thunderstorms, p, is ______ (to nearest 0.1%).A. 21.0% < p < 39.8%
B. 25.6% < p < 35.2%
C. 22.5% < p < 38.3%Correct Answer: C
The confidence interval is p' - E < p < p' + E. Let x count the number of days with thunderstorms; p' is x/n = 28/92 = 0.304. The computation of E is shown at the top right. So, E = 0.079 and the confidence interval is 22.5% < p < 38.5%.

Practice Question 34
A researcher randomly samples 100 residents of Florida and finds that 95 of the citizens are literate. The researcher then finds a 90% confidence interval. Which of the following is false?A. The researcher is 90% sure that the percentage of literate citizens is between 91.4% and 98.6%.
B. The sample proportion p' is 0.95 and the margin of error is 3.6%.
C. The confidence interval procedure is invalid because Np' and N(1 - p') are not both greater than 5.Correct Answer: A
The procedure used for confidence intervals assumes that Np' > 5 and that N(1 -p') > 5. Because this is not the case and 100(1 - 0.95) = 5, the researcher cannot conclude with 90% confidence that the percentage of Florida citizens that are literate is between 91.4% and 98.6%.
Practice Question 35
A confidence interval was used to estimate the proportion of American new car owners who purchased domestic cars. A random sample of 58 new car owners generated the following 90% confidence interval: 0.376, 0.426.Based on the interval given, does the mean population proportion of new car owners who purchased domestic cars exceed 39%?
A. Yes. The researcher has 90% confidence in the result.
B. The researcher cannot conclude that the mean exceeds 39% at the 90% confidence level.
C. No. The researcher has 90% confidence in the result.Correct Answer: B
Practice Question 36
Increasing the confidence level while keeping other values constant has what effect on the width of the confidence interval?A. There is not enough information to determine the effect.
B. The error of estimate increases; therefore, the width of the interval increases.
C. The error of estimate decreases; therefore, the width of the interval decreases.Correct Answer: B
Practice Question 37
A survey of 144 retail stores revealed that a particular brand and model of TV retails for $375 with a standard deviation of $20.If 95% and 98% confidence intervals are developed to estimate the true cost of the TV, what difference would they have?
A. interval widths
B. both interval widths and z-variates
C. z-variatesCorrect Answer: B
The interval widths and the z-variates differ according to the rule chosen. The standard error is the same regardless.
Practice Question 38
A hedge fund is interested in knowing how low an annual return their strategy might generate as a once-in-100-years event. The strategy in question has an expected annual return of 20% with a standard deviation of 35%. You believe these returns are normally distributed. What is the lowest return that could be expected once in 100 years?A. -51.9%
B. -45.7%
C. -61.4%Correct Answer: C
Once in 100 years is 1/100 = 1%. So, the client seeks the 1st percentile return. This could be obtained by computing a 99% confidence interval. However, since our information will be based at the mean, we should seek the 98% confidence interval, where the 2% is split between the lower and upper bounds of the distribution. That way, we can obtain the lower 1% figure. The lower bound of the 98% confidence interval is 20% - 35%*2.325 = -61.4%.
Practice Question 39
A retail client of yours is interested in knowing how high an annual return a major stock index might have, as a once-in--twenty-years event. The index in question has had an annual return of 11% with a standard deviation of 22%. You believe these returns have been normally distributed. What is the highest return that could be expected once in twenty years?A. 54.1%
B. 22.0%
C. 47.2%Correct Answer: C
Once in twenty years is 1/20 = 5%. So the client seeks the 95th percentile return. This could be obtained by computing a 95% confidence interval. However, since our information will be based at the mean, we should seek the 90% confidence interval, where the other 10% is split between the lower and upper bounds of the distribution. That way, we can obtain the upper 5% figure. The upper bound of the 90% confidence interval is 11% + 22%*1.645 = 47.2%.
Practice Question 40
A retail client of yours is interested in knowing how low an annual return a major stock index might have, as a once-in--twenty-years event. The index in question has had an annual return of 11% with a standard deviation of 22%. You believe these returns have been normally distributed. What is the lowest return that could be expected once in twenty years?A. -11.0%
B. -25.2%
C. -32.1%Correct Answer: B
Once in twenty years is 1/20 = 5%. So, the client seeks the 5th percentile return. This could be obtained by computing a 95% confidence interval. However, since our information will be based at the mean, we should seek the 90% confidence interval, where the other 10% is split between the lower and upper bounds of the distribution. That way, we can obtain the lower 5% figure. The lower bound of the 90% confidence interval is 11% - 22%*1.645 = -25.2%.
Practice Question 41
Which set of circumstances is most likely to result in a narrow confidence interval?A. large n and a degree of confidence of 0.95
B. large n and a degree of confidence of 0.99
C. small n and a degree of confidence of 0.95Correct Answer: A
Practice Question 42
To estimate the average SAT scores for entering freshmen at universities, a random sample of 14 SAT scores is collected. If the sample mean produced a score of 1150 and the sample standard deviation is 150 points (σ is unknown) then a 95% confidence interval is ______.A. 1079.4 < μ < 1220.6
B. 1063.4 < μ < 1236.6
C. 1079.0 < μ < 1221.0Correct Answer: B
For a 95% confidence interval, σ unknown, we find t(0.025, 13), the cutoff for the top 2.5% of the t-distribution, df = 13. Looking in the t-table under column 0.025 and down to row 13, we get 2.16. Working with the formula for E, we get E = 86.6. So, the 90% confidence interval is 1150 - 86.6 < μ < 1150 + 86.6 or 1063.4 < μ < 1236.6.

Practice Question 43
To estimate the average length of their employees' telephone calls, FoneJack, Inc. randomly sampled 15 employee phone calls. If the sample mean was 1.3 minutes and the sample standard deviation was 0.3 minutes (s is unknown) then a 90% confidence interval for the phone calls is ______.A. 1.16 < m < 1.44
B. 1.2 < m < 1.4
C. 1.0 < m < 1.6Correct Answer: A
For a 90% confidence interval, s unknown, we find t(0.05, 14), the cutoff for the top 5% of the t-distribution, df = 14. Looking in the t-table under column 0.05 and down to row 14, we get 1.761. Working with the formula for E, we get E = 0.14. So, the 90% confidence interval is 1.3 - 0.14 < m < 1.3 + 0.14 or 1.16 < m < 1.44.

Practice Question 44
There are 2,000 eligible voters in a precinct. Despite protests from knowledgeable persons that a sample size of 500 was too large in relation to the total, the 500 selected at random were asked to indicate whether they planned to vote for the Democratic incumbent or the Republican challenger. Of the 500 surveyed, 350 said they were going to vote for the Democratic incumbent. Using the 0.99 confidence coefficient, what are the confidence limits for the proportion who plan to vote for the Democratic incumbent?A. 0.397 and 0.797
B. 0.612 and 0.712
C. Neither of these answers are correct.Correct Answer: C
The interval estimate can be found from np ± z[np(1-p)/n]0.5. Here we have n = 500, p = 350/500 = 0.7 and z = 2.58 (for 99%).
Therefore, 500* 0.7 ± 2.58*0.4583; we get 348.8177 and 351.1823.
Practice Question 45
Calculate an 80% confidence interval for a population mean. You have a sample of 21, a sample mean of -25%, and a sample standard deviation of 10%. The sample appears to be approximately normally distributed.A. [-26%, -24%]
B. [-28%, -22%]
C. [-27%, -23%]Correct Answer: B
Based on the data given, we should use the t-distribution. The critical value will be based at t_(0.10, 20) and is 1.325. Our confidence interval will then be [-25% - 1.325*(10%)/(210.5), -25% + 1.325*(10%)/(210.5)] = [-28%, -22%].
Practice Question 46
Calculate a 90% confidence interval for a population mean. You have a sample of 21, a sample mean of -25%, and a sample standard deviation of 10%. The sample appears to be approximately normally distributed.A. [-28.9%, -21.1%]
B. [-27.9%, -22.1%]
C. [-28.1%, -21.9%]Correct Answer: A
Based on the data given, we should use the t-distribution. The critical value will be based at t_(0.05, 20) and is 1.725. Our confidence interval will then be [-25% - 1.725*(10%)/(210.5), -25% + 1.725*(10%)/(210.5)] = [-28.9%, -21.1%].
Practice Question 47
If the size of the sample being used increases, the width of a 0.95 confidence interval estimate for a population mean will ______.A. become narrower
B. become wider
C. not changeCorrect Answer: A
Practice Question 48
Which statement(s) regarding the selection of an appropriate sample size is (are) false?I. If the population is normally distributed and the population variance is known, use a t-score irrespective of sample size.
II. If the population is normally distributed and the population variance is unknown, use a z-score irrespective of sample size.
III. If the population is not normally distributed and the population variance is known, use a F-score only if n >= 30; otherwise it cannot be done.
IV. If the population is not normally distributed and the population variance is unknown, use a X2-score only if n >= 30; otherwise it cannot be done.
A. I and II
B. II, III and IV
C. I, II, III and IVCorrect Answer: C
All these statements are false. The correct statements would have been:
- If the population is normally distributed and the population variance is known, use a z-score irrespective of sample size.
- If the population is normally distributed and the population variance is unknown, use a t-score irrespective of sample size.
- If the population is not normally distributed and the population variance is known, use a z-score only if n >= 30; otherwise it cannot be done.
- If the population is not normally distributed and the population variance is unknown, use a t-score only if n >= 30; otherwise it cannot be done.
Practice Question 49
Consider the following statements:I. The t-distribution is a symmetrical probability distribution defined by a single parameter known as the degrees of freedom.
II. When sample size is small and population variance is not known, the t-distribution is used.
III. The use of a t reliability factor is appropriate when the population variance is unknown but we have a large sample and can rely on the central limit theorem to ensure approximate normality of the distribution of the sample mean.
Which is true?
A. I and II
B. I and III
C. I, II and IIICorrect Answer: B
Some facts about the t-distribution are:
- The t-distribution is a symmetrical probability distribution defined by a single parameter known as the degrees of freedom.
- When sample size is small and population variance is not known, the t-distribution is used if the population is normally distributed (this is unknown in this question).
- The use of a t reliability factor is appropriate when the population variance is unknown but we have a large sample and can rely on the central limit theorem to ensure approximate normality of the distribution of the sample mean
Practice Question 50
Consider the following statements relating to sample size and confidence intervals:I. The width of a confidence interval decreases as the sample size increases.
II. When the width of a confidence interval decreases, this is due to standard error becoming smaller.
III. More precise results are obtained when the sample size is increased.
Which is true?
A. II and III
B. I and III
C. I, II and IIICorrect Answer: C
The following statements relate to sample size and confidence intervals:
- The width of a confidence interval decreases as the sample size increases.
- When width of a confidence interval decreases, this is due to standard error becoming smaller.
- More precise results are obtained when the sample size is increased.
Practice Question 51
A normal distribution has a mean of 25% and a standard deviation of 33%. What is the 95% confidence interval around the mean (i.e., if 95% of observations can be expected to fall in this range)?A. -29.29; 79.29
B. -8.00; 58.00
C. -39.68; 89.68Correct Answer: C
The 95% confidence interval corresponds to a multiple of 1.96 for standard deviation. Thus, the range or interval is 25% ± 1.96 x 33% = [-39.68, 89.68].
Practice Question 52
The mean of a sample with a known population variance of 25 was estimated as 12.5. The sample size was 22 and the sample variance was 28. Which of the following represents the appropriate 95% confidence interval for the normally distributed population?A. 10.41; 14.59
B. 10.29; 14.71
C. 10.74; 14.26Correct Answer: A
Since the population variance is known and it is normally distributed, we will ignore the sample variance. A 95% confidence interval corresponds to a z-value of 1.96. Thus, CI is given by 12.5 ± 1.96 x (25/22)1/2 or [10.41, 14.59].
Practice Question 53
An increase in which of the following items is most likely to result in a wider confidence interval for the population mean?A. sample size
B. degrees of freedom
C. reliability factorCorrect Answer: C
An increase in the reliability factor (the degree of confidence) increases the width of the confidence interval. Increasing the sample size and increasing the degrees of freedom both shrink the confidence interval.

Study notes from a previous year's CFA exam:
5. Confidence Intervals for the Population Mean and Selection of Sample Size