- CFA Exams
- 2026 Level I
- Topic 9. Portfolio Management
- Learning Module 2. Portfolio Risk and Return: Part II
- Subject 6. Applications of the CAPM
Why should I choose AnalystNotes?
Simply put: AnalystNotes offers the best value and the best product available to help you pass your exams.
Subject 6. Applications of the CAPM PDF Download
Security Characteristic Line
A security characteristic line (SCL) graphs the relationship between the excess market return and excess security return.
If we compare the SML and the SCL:

While there is only one SML, there are many different SCLs for securities with different betas.
Security Selection
Overvalued and undervalued securities are those securities that do not lie on the SML line. By definition, securities that are efficiently priced should fall directly on the (calculated) SML line. If a security is above the line it is deemed undervalued since it is providing more expected return than what is demanded for that risk level. Securities falling below the SML line, on the other hand, provides less return than the market demands. Securities that fall below the SML are considered overvalued. In the former case, the security price will be bid up, such that the expected return declines and the security falls back to the SML line. In a situation where the security is overvalued, the security price declines until the expected return rises.
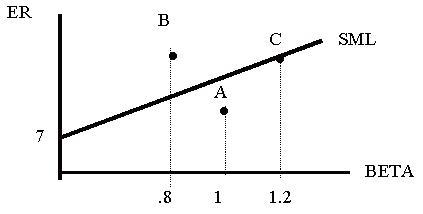
All assets and all portfolios should plot on the SML.
- Stock C has an estimated rate of return equal to its systematic risk or required rate of return.
- Stock B is expected to provide a rate of return above the required rate of return.
- Stock A is expected to provide a rate of return below the required rate of return.
- Investors should buy B (undervalued).
- Investors should sell A (overvalued).
Constructing a Portfolio
As the number of securities increases, the portfolio manager can eliminate unsystematic risk (or diversifiable risk) and focus on systematic or undiversifiable risk. As you can see, much of the unsystematic risk can be diversified away in as few as 30 securities.
To construct a market portfolio you can start with a portfolio of securities like the S&P 500. You can then evaluate the α of any security, using the CAPM and the S&P 500 as the market portfolio. If the α is positive, add the security to the portfolio. If a security's α is negative and it is already included in the portfolio, remove it. You can also use the information ratio of each individual security to determine the relative weight of the security in the portfolio.
User Contributed Comments 6
| User | Comment |
|---|---|
| papajeff | It would be easier to be interested in this if any of it actually worked. |
| johntan1979 | It IS easy to be interested in this if $1,000 bucks means a lot to you and one question from this topic is all that matters between passing and failing. |
| robertucla | yes, kind of sucks we still have to learn this even though most of this proven wrong |
| jonan203 | right or wrong, there are two sides to every trade and knowing how your enemy thinks will give you an edge over any trades they make. know thine enemy = victory |
| RamaG | @jonathan: as important 1k might be, having to re-appear in 6 mos / 1 yr and re- read L1 LOS and missing the boat on L2 by 6 mos - 1 yr is a motivation enought to go thought every line comprehensively :)) |
| Allen88 | ut doesn't a positive alpha comes from most recent returns and thus we still have uncertainty about its future returns??? |

Your review questions and global ranking system were so helpful.

Lina
My Own Flashcard
No flashcard found. Add a private flashcard for the subject.
Add