- CFA Exams
- 2023 Level I > Topic 9. Portfolio Management > Reading 54. Technical Analysis
- 4. Common Chart Patterns
Seeing is believing!
Before you order, simply sign up for a free user account and in seconds you'll be experiencing the best in CFA exam preparation.
Subject 4. Common Chart Patterns
The difficulty in identifying chart patterns and their subsequent signals is that chart use is not an exact science. In fact, it's often viewed as more of an art than a science. While there is a general idea and components to every chart pattern, price movements do not necessarily correspond to the pattern suggested by the chart. This should not discourage potential users of charts; once the basics of charting are understood, the quality of chart patterns can be enhanced by looking at volume and secondary indicators.
There are two types of charts.
- A reversal pattern signals that a prior trend will reverse on completion of the pattern.
- Conversely, a continuation pattern indicates that the prior trend will continue onward upon the pattern's completion.
Reversal Patterns
The head and shoulders pattern looks like a head with two shoulders. It is formed by a peak (shoulder), followed by a higher peak (head), and then another lower peak (shoulder). A "neckline" is drawn by connecting the lowest points of the two troughs.
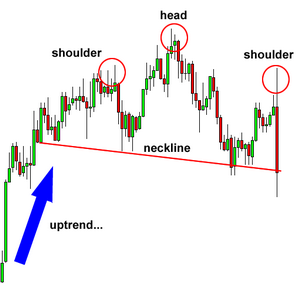
The pattern is considered to be a trend-reversal pattern, as the security heads down after the pattern's completion.
Volume plays an important role in confirmation as the head and shoulders pattern unfolds. Ideally, but not always, volume during the advance of the left shoulder should be higher than during the advance of the head. This decrease in volume and the new high of the head together serve as a warning sign. The next warning sign comes when volume increases on the decline from the peak of the head. Final confirmation comes when volume further increases during the decline of the right shoulder.
We can also calculate a target by measuring from the high point of the head to the neckline. This distance is approximately how far the price will move after it breaks the neckline: Price target = Neckline - (Head - Neckline)
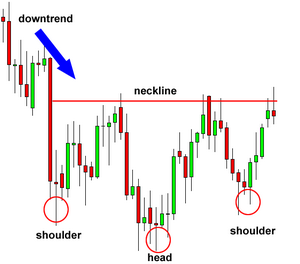
Inverse head and shoulders pattern: The name speaks for itself. It is basically a head and shoulders formation, except this time it's upside down. The price target is: Neckline + (Neckline - Head).
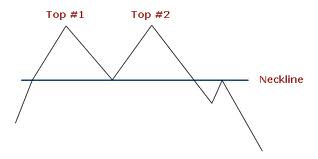
A double top pattern is created when a price movement tests resistance level twice and is unable to break through. The trend then reverses and the price heads down.
In the case of a double bottom, the price movement has tried to go lower twice but has found support each time. After the second bounce off of the support, the security enters a new trend and heads upward.
Similarly, triple tops and triple bottoms can be formed.
Continuation Patterns
Continuation patterns indicate a pause in trend and indicate that the previous direction will resume after a period of time.
The basic construct of the triangle pattern is the convergence of two trendlines - flat, ascending, or descending - with the price of the security moving between the two trendlines. There are three formations:
- The ascending triangle is a bullish formation that usually forms during an uptrend. Two or more equal highs form a horizontal line at the top. This line represents overhead supply that prevents the security from moving past a certain level. Two or more rising troughs form an ascending trend line that converges on the horizontal line as it rises. Even though the price cannot rise past this horizontal line, the reaction lows continue to rise. It is these higher lows that indicate increased buying pressure and give the ascending triangle its bullish bias.
- The descending triangle is a bearish formation that usually forms during a downtrend. Two or more comparable lows form a horizontal line at the bottom. The horizontal line represents demand that prevents the security from declining past a certain level. Two or more declining peaks form a descending trend line above that converges with the horizontal line as it descends. Even though the price does not decline past this level, the reaction highs continue to decline. It is these lower highs that indicate increased selling pressure and give the descending triangle its bearish bias.
- The symmetrical triangle, which can also be referred to as a coil, usually forms during a trend as a continuation pattern. The pattern contains at least two lower highs and two higher lows. When these points are connected, the lines converge as they are extended and the symmetrical triangle takes shape.
The rectangle pattern is easily identifiable by two comparable highs and two comparable lows. The highs and lows can be connected to form two parallel lines that make up the top and bottom of a rectangle.
Rectangles represent a trading range that pits the bulls against the bears. As the price nears support, buyers step in and push the price higher. As the price nears resistance, bears take over and force the price lower.
Finally, price will break out of the rectangle's range, either by moving through support or resistance. If the prior trend was an uptrend, the most likely direction will be up; if the prior trend was a downtrend, the most likely direction will be down.
Flags and pennants are short-term continuation patterns that mark a small consolidation before the previous move resumes.
There is little difference between a pennant and a flag.
Practice Question 1
In the head and shoulders pattern, which part is the first signal that the rally may be coming to an end?A. The head
B. The right shoulder
C. The necklineCorrect Answer: A
A reversal may be starting from the head.
Practice Question 2
When a price reaches a low, rebounds, and then sells off back to the first low level, a ______ pattern is formed.A. double top
B. double bottom
C. top and bottomCorrect Answer: B

Practice Question 3
Typically in a descending triangle, the ______ prices form a horizontal trendline and the ______ prices form a series of lower and lower highs.A. low; high
B. high; low
C. low; lowCorrect Answer: A
A descending triangle typically forms in a downtrend.
Practice Question 4
In a head and shoulders pattern: left shoulder: $25; head: $32; right shoulder: $26; neckline: $22.What would be a technician's price target?
A. $12
B. $22
C. $22.5Correct Answer: A
After breaking neckline support, the projected price decline is found by measuring the distance from the neckline to the top of the head. This distance is then subtracted from the neckline to reach a price target.
Price target = 22 - (32 - 22) = $12
Practice Question 5
If a security just experienced a double top pattern, its price is expected to ______.A. go up
B. go down
C. either go up or go downCorrect Answer: B
Price is expected to decline.
Practice Question 6
A flag looks like a small ______.A. symmetrical triangle
B. rectangle
C. head and shouldersCorrect Answer: B
Practice Question 7
In chart-pattern analysis, volume plays an important role as a secondary indicator. Volume indicates activity and money movement. When volume is high, there is a lot of activity and money changing hands; this makes it an important indicator to follow.For the head-and-shoulders pattern, volume can also be used as a secondary indicator during the formation of the pattern, well before the breakout, to gain an idea of the pattern's strength. For example, the run towards the peak in the head should be on ______ volume compared to the peak formed in the left shoulder.
A. lighter
B. heavier
C. the sameCorrect Answer: A
This should be a warning, as volume should move with trends, not against them. The peak formed in the right shoulder should be seen with even lighter volume than in either the head or the left shoulder. And again, the volume should be high when the neckline is broken (this is by far the most important area to watch in terms of volume).
Practice Question 8
Which one of these patterns is not a reversal pattern?A. Triple bottom
B. Inverse head and shoulders
C. PennantCorrect Answer: C
Note that just because a pattern forms after a significant advance or decline does not mean it is a reversal pattern. Many patterns, such as a rectangle, can be classified as either reversal or continuation. Much depends on the previous price action, volume, and other indicators as the pattern evolves. This is where the science of technical analysis becomes the art of technical analysis.
Practice Question 9
The inverse head and shoulders pattern signals that ______A. the security is set to make an upward move.
B. the security is set to make a downward move.
C. the security is set to make an upward and then a downward move.Correct Answer: A
Often coming at the end of a downtrend, the inverse head and shoulders pattern is considered to be a reversal pattern, as the security typically heads higher after the completion of the pattern.

Practice Question 10
In an ascending triangle, the trendline that connects multiple highs during the line ______.A. is horizontal
B. slopes upward
C. slopes downwardCorrect Answer: A
The line indicates some resistance above current prices.
Practice Question 11
Two comparable highs and two comparable lows will most likely form (a) ______.A. symmetrical triangle
B. rectangle
C. double tops and bottomsCorrect Answer: B
One trendline connects the two high prices and one trendline connects the two low prices. A rectangle patterns can be formed with these two parallel trendlines.
Practice Question 12
A pennant looks like a small ______.A. symmetrical triangle
B. rectangle
C. head and shouldersCorrect Answer: A
Practice Question 13
Once a head and shoulders pattern is formed, the expectation is that ______A. the market will rally again.
B. the price will remain around the neckline and the market will be in balance.
C. the price will decline down through the neckline price.Correct Answer: C
The head and shoulders pattern is not complete and the uptrend is not reversed until neckline support is broken and becomes a new resistance level.
Practice Question 14
In a head-and-shoulders top, the peak of the head is formed at $50 and the neckline is established at $40. The price objective for a technician would be ______.A. $30
B. $40
C. $45Correct Answer: A
The price objective is calculated by subtracting the price at which the pattern breaks the neckline ($40) by the difference between the head and the neckline ($10). Based on this example, the price objective is $30 ($40 - $10).
This price objective is not an absolute and is used as a guideline to the attractiveness of a trade. The larger the difference between the objective and the price at the neckline, the more worth a trade has, as it will yield greater returns.
Practice Question 15
In an inverse head and shoulders pattern, the low price reached at the bottom of the head is $40 and the neckline is established at $50. The price objective for a technician would be ______.A. $30
B. $45
C. $60Correct Answer: C
50 + (50 - 40) = 60
Practice Question 16
The head and shoulders pattern signals that ______A. the security is set to make an upward move.
B. the security is set to make a downward move.
C. the security is set to make an upward and then a downward move.Correct Answer: B
Often coming at the end of an uptrend, the head and shoulders pattern is considered to be a reversal pattern, as the security typically heads lower after the completion of the pattern.
Practice Question 17
When an uptrend reverses twice at roughly the same high price level, a ______ pattern is formed.A. double top
B. double bottom
C. top and bottomCorrect Answer: A

Practice Question 18
Typically in an ascending triangle, the ______ prices form a horizontal trendline and the ______ prices form a series of higher and higher lows.A. low; high
B. high; low
C. low; lowCorrect Answer: B
Found within an uptrend, the ascending triangle forms as a consolidation period within the uptrend and indicates upside continuation will follow.
Practice Question 19
In a descending triangle, the trend line that connects multiple lows during the line ______.A. is horizontal
B. slopes upward
C. slopes downwardCorrect Answer: A
The horizontal trend line serves as support which temporarily prevents the stock from declining, while the descending trend line above the stock signals that sellers are still present.
Practice Question 20
If a security just experienced a double bottom pattern, its price is expected to ______.A. go up
B. go down
C. either go up or go downCorrect Answer: A
Technicians use the double bottom to predict a change from a downtrend to an uptrend in security prices. For double bottoms, the price is expected to appreciate above the peak between the two bottoms by at least the distance from the valley lows to the peak.
Practice Question 21
If a security just experienced a triple bottom pattern, its price is expected to ______.A. go up
B. go down
C. either go up or go downCorrect Answer: A
Technicians use the triple bottom to predict a change from a downtrend to an uptrend in security prices.
Practice Question 22
If a security just experienced a triple top pattern, its price is expected to ______.A. go up
B. go down
C. either go up or go downCorrect Answer: B
Technicians use the triple top to predict a change from an uptrend to a downtrend in security prices.
Practice Question 23
Which one of these patterns is not a continuation pattern?A. Flag
B. Rectangle
C. Double topCorrect Answer: C
This is a reversal pattern.
Practice Question 24
A flag pattern is similar to a ______.A. triangle pattern
B. head and shoulders pattern
C. pennant patternCorrect Answer: C
These patterns are very similar and have the same uses. The only difference is that in a pennant the middle section is characterized by converging trendlines, much like those seen in a symmetrical triangle. The middle section on the flag pattern, on the other hand, shows a channel pattern, with no convergence between the trendlines. In both cases, the trend is expected to continue when the price moves above the upper trendline.
Practice Question 25
The key difference between a triangle pattern and a pennant pattern is that ______A. a pennant pattern is a special case of the triangle pattern.
B. a pennant always slopes in a direction opposite to the trend up to that time while a triangle can slope both ways.
C. a pennant is a short-term formation whereas a triangle is a long-term formation.Correct Answer: C
A pennant more than 12 weeks old would turn into a symmetrical triangle.
Practice Question 26
Which statement is false?A. Continuation patterns suggest the market will maintain an established trend.
B. Continuation patterns help traders differentiate between a price action in full reversal and those merely taking a pause.
C. The left and right shoulders in a head and shoulders pattern are always symmetrical.Correct Answer: C
C is not true. Symmetry is not an absolute requirement. Shoulders can be different widths as well as different heights.

Study notes from a previous year's CFA exam:
4. Common Chart Patterns