- CFA Exams
- 2023 Level I > Topic 9. Portfolio Management > Reading 54. Technical Analysis
- 5. Technical Indicators
Why should I choose AnalystNotes?
Simply put: AnalystNotes offers the best value and the best product available to help you pass your exams.
Subject 5. Technical Indicators
Price-Based Indicators
Price-based indicators incorporate information contained in market prices.
A moving average is the average price of a security over a set amount of time. By plotting a security's average price, the price movement is smoothed out. Once the day-to-day fluctuations are removed, traders are better able to identify the true trend.
Moving averages can be used to quickly identify whether a security is moving in an uptrend or a downtrend depending on the direction of the moving average. As you can see in the figure below, when a moving average is heading upward and the price is above it, the security is in an uptrend. Conversely, a downward-sloping moving average with the price below can be used to signal a downtrend.
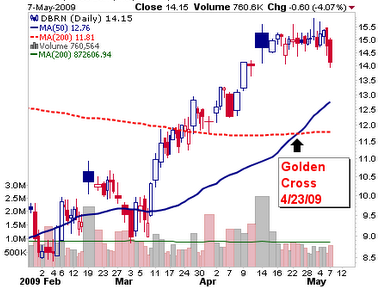
A golden cross is a crossover involving a security's short-term moving average (such as a 15-day moving average) breaking above its long-term moving average (such as a 50-day moving average) or resistance level. As long-term indicators carry more weight, the golden cross indicates a bull market on the horizon and is reinforced by high trading volumes. Additionally, the long-term moving average becomes the new support level in the rising market.
A dead cross shows the opposite movement of the moving average.
Bollinger Bands are volatility bands placed above and below a moving average. Volatility is based on the standard deviation. The bands automatically widen when volatility increases and narrow when volatility decreases.
Momentum Oscillators
Generally speaking, momentum measures the rate of change of a security's price. As the price of a security rises, price momentum increases. The faster the security rises (the greater the period-over-period price change), the larger the increase in momentum. Once this rise begins to slow, momentum will also slow. As a security begins to trade flat, momentum starts to actually decline from previous high levels.
Momentum oscillators can be used to determine the strength of a trend and to signal a pending trend reversal.
A rate of change oscillator (ROC) or a momentum oscillator measures the percentage price change over a given time period. For example: 20 day ROC would measure the percentage price change over the last 20 days. The bigger the difference between the current price and the price 20 days ago, the higher the value of the ROC oscillator.
- When the indicator is above 0, the percentage price change is positive (bullish).
- When the indicator is below 0, the percentage price change is negative (bearish).
A relative strength index (RSI) compares the average price change of the advancing periods with the average change of the declining periods. It is a momentum oscillator that measures the speed and change of price movements.
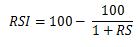
where RS = average gain / average loss
RSI oscillates between zero and 100. Traditionally RSI is considered overbought when above 70 and oversold when below 30.
The RSI should be used with other technical tools such as trend analysis or pattern analysis.
A stochastic oscillator is a momentum indicator that shows the location of the close relative to the high-low range over a set number of periods.
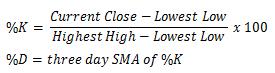
Because the stochastic oscillator is range-bound, it is also useful for identifying overbought and oversold levels. It is above 50 when the close is in the upper half of the range and below 50 when the close is in the lower half. Low readings (below 20) indicate that price is near its low for the given time period. High readings (above 80) indicate that price is near its high for the given time period.
When using the stochastic oscillator it is important to identify the bigger trend and trade in the direction of this trend. For example, securities can become overbought and remain overbought during a strong uptrend. Closing levels that are consistently near the top of the range indicate sustained buying pressure.
The moving average convergence-divergence (MACD) turns two trend-following indicators, moving averages, into a momentum oscillator by subtracting the longer moving average from the shorter moving average. As a result, MACD offers the best of both worlds: trend-following and momentum.
- MACD line: 12-day EMA - 26-day EMA (EMA: exponential moving average)
- Signal line: 9-day EMA of MACD
MACD fluctuates above and below the zero line as the moving averages converge, cross, and diverge.
- Convergence occurs when the moving averages move towards each other.
- Divergence occurs when the moving averages move away from each other.
Sentiment Indicators
Sentiment indicators attempt to gauge investor activity for signs of increasing bullishness or bearishness. They are used to quantify the levels of optimism or pessimism present in various markets.
Opinion polls to gauge investors' sentiments towards the equity market are conducted by a variety of services. Contrarians believe that if a large proportion of investment advisory services have a bearish attitude, this signals the approach of a market trough and the onset of a bull market.
Commonly used calculated statistical indices are:
- Put/call ratio. Put options are believed to be signals of bearish attitudes. Technicians reason that a higher put/call ratio indicates a more pervasive bearish attitude, which they consider a bullish indicator. The ratio typically has been substantially less than 1 since investors tend to be bullish and avoid selling short or buying puts.
- The CBOE Volatility Index, often referred to as the fear index, measures the implied volatility of S&P 500 index options. It represents one measure of the market's expectation of stock market volatility over the next 30-day period.
- Margin debt. Debt balances in brokerage accounts represent borrowing by knowledgeable investors from their brokers. These balances indicate the attitude of a sophisticated group of investors who engage in margin transactions. An increase would be a bullish sign while a decline would indicate selling as these sophisticated investors liquidate their positions (and this could indicate less capital available for investing).
- Short interest ratio. This ratio is derived by dividing the short interest by the average daily volume for a stock. It provides a number that is used by investors to determine how long it will take short sellers, in days, to cover their entire positions if the price of a stock begins to rise. The higher the ratio, the longer it will take to buy back the borrowed shares - an important factor, upon which traders or investors decide whether to take a short position.
Flow-of-Funds Indicators
Flow-of-funds indicators attempt to measure the ability or the financial position of different investor groups. These indicators try to measure their capacity of these groups to buy or sell stocks. They also attempt to measure where the money is going.
- An arms index, also called the TRIN, is a breadth indicator that measures the relative extent to which money is moving into or out of rising and declining stocks. A ratio of 1 means the market is in balance; above 1 indicates that more volume is moving into declining stocks and below 1 indicates that more volume is moving into advancing stocks.
- Margin debt can also be used as a flow-of-funds indicator.
- Mutual fund cash position. Mutual funds hold some part of their portfolio in cash. The cash ratios (ratios of cash as a percentage of the total assets in mutual funds' portfolio) are usually from 5-13%. A high percentage of cash is a bearish indicator, and vice versa. A high mutual fund cash position also can be considered as a bullish indicator because of potential buying power, since technicians believe that these cash funds will eventually be invested and will cause stock prices to increase (and vice versa).
- New equity issuance. This indicator suggests that as the number of IPOs increases, the upward price trend may be about to turn down.
- Secondary offerings. These increase the supply available for trading.
Cycles
Many technicians use various observed cycles to predict future movements in security prices.
Kondratieff waves are described as regular, sinusoidal-like cycles in the modern (capitalist) world economy. Averaging fifty and ranging from approximately forty to sixty years in length, the cycles consist of alternating periods between high sectoral growth and periods of relatively slow growth.
Real estate prices seem to follow an 18-year cycle, with a short recession at the mid-point of each cycle and a longer recession at the end-point.
The decennial pattern is the pattern of average stock market returns broken down on the basis of the last digit in the year.
The presidential cycle states that U.S. stock markets are the weakest in the year following the election of a new U.S. president. According to this theory, after the first year the market improves until the cycle begins again with the next presidential election.
Practice Question 1
What is a dead cross?A. When a short-term moving average crosses from above a longer-term moving average, it is called a dead cross.
B. When a short-term moving average crosses from below a longer-term moving average, it is called a dead cross.
C. When a price line crosses from above a moving average, it is called a dead cross.Correct Answer: A
A dead cross is when a short-term moving average crosses from above a longer-term moving average.
Practice Question 2
When the average gain is zero, RSI becomes ______.A. zero
B. 50
C. 100Correct Answer: A
Assuming a 14-period RSI, a zero RSI value means prices moved lower or have not moved at all in 14 periods. There were no gains to measure.
Practice Question 3
Traditional settings use ______ as the overbought threshold and ______ as the oversold threshold for the stochastic oscillator.A. 100; 0
B. 80; 20
C. 70; 30Correct Answer: B
These levels can be adjusted to suit analytical needs and security characteristics.
Practice Question 4
Which one is a sentiment indicator?A. Opinion polls
B. Stochastic oscillator
C. Bollinger banksCorrect Answer: A
A wide range of services conduct these polls to gauge investors' sentiments about the equity market.
Practice Question 5
The days-to-cover ratio refers to ______.A. margin debt ratio
B. short interest ratio
C. put/call ratioCorrect Answer: B
The short interest ratio indicates, given a stock's average trading volume, how many days it will take short sellers to cover their positions if positive news about the company lifts the price. The ratio is used by both fundamental and technical traders to identify the prevailing sentiment the market has for a specific stock.
Practice Question 6
An arms index of 1 means the market is in ______.A. a selling mood
B. balance
C. a buying moodCorrect Answer: B
The arms index is a volume-based indicator, which determines market strength and breadth by analyzing the relationship between advancing and declining issues and their respective volume. It is used to measure intra-day market supply and demand, and it can be applied over short or longer time periods.
An index value of 1.0 indicates that the ratio of up volume to down volume is equal to the ratio of advancing issues to declining issues. The market is said to be in a neutral state when the index equals 1.0 since the up volume is evenly distributed over the advancing issues and the down volume is evenly distributed over the declining issues.
Practice Question 7
Which one is a momentum oscillator?A. Short interest ratio
B. Bollinger bands
C. Relative strength indexCorrect Answer: C
An RSI graphically compares a security's gains with its losses over a set period.
Practice Question 8
Margin debt cannot be used as a ______.A. sentiment indicator
B. momentum indicator
C. flow-of-funds indicatorCorrect Answer: B
It can be used as either a sentiment indicator or a flow-of-funds indicator.
Practice Question 9
Bollinger Bands are constructed by shifting a moving average up and down by ______.A. a certain number of points
B. a fixed percentage
C. a set number of standard deviationsCorrect Answer: C

Practice Question 10
Which technical indicator measures the percent change in price from one period to the next?A. Momentum oscillator
B. Stochastic oscillator
C. MACDCorrect Answer: A
The ROC calculation compares the current price with the price n periods ago.
Practice Question 11
All other factors being equal, which RSI is the most likely to reach overbought or oversold levels?A. A 5-day RSI
B. A 14-day RSI
C. A 22 day RSICorrect Answer: A
The look-back period can be lowered to increase sensitivity. The default look-back period for a RSI is 14.
Practice Question 12
Which momentum indicator is unbounded?A. Relative strength index
B. Stochastic oscillator
C. MACDCorrect Answer: C
Because MACD is unbounded (it does not have any upper or lower limits to bind its movement), it is not particularly useful for identifying overbought and oversold levels.
Practice Question 13
There are five billion shares sold short in August and the average daily volume on the NYSE for the same period is one billion shares per day. This gives us a NYSE short-interest ratio of ______.A. 0.2
B. 1
C. 5Correct Answer: C
5 = five billion /one billion. This means that, on average, it will take five days to cover the entire short position on the NYSE. In theory, a higher NYSE short-interest ratio indicates a more bearish sentiment towards the exchange.
Practice Question 14
Which indicator is the best if we want to determine the strength of a trend?A. A moving average
B. A momentum oscillator
C. An arms indexCorrect Answer: B
Practice Question 15
Which indicator is derived from the simplest formula?A. A moving average
B. A stochastic oscillator
C. A relative strength indexCorrect Answer: A
A simple moving average is an indicator that calculates the average price of a security over a specified number of periods. If a security is exceptionally volatile, then a moving average will help smooth the data. A moving average filters out random noise and offers a smoother perspective on the price action.
Practice Question 16
Typically, an RSI is considered overbought if it is ______.A. below 30
B. above 70
C. between 30 and 70Correct Answer: B
Remembering the 30-70 range is a good rule of thumb.
Practice Question 17
Which factors can affect the sensitivity of the stochastic oscillator?I. The length of the time frame
II. The volatility of the securityCorrect Answer: Both I and II
For I: the shorter the look-back period, the more sensitive the stochastic oscillator becomes.
Practice Question 18
Which one is a momentum oscillator?A. The CBOE Volatility Index
B. A put/call ratio
C. A stochastic oscillatorCorrect Answer: C
A stochastic oscillator doesn't follow price; it doesn't follow volume or anything like that. It follows the speed or the momentum of price. As a rule, momentum changes direction before price.
Practice Question 19
A cumulative number of shares that have been sold short and not covered is called ______.A. the margin position
B. the short interest
C. short volumeCorrect Answer: B
Practice Question 20
When technical analysts say a stock has good "relative strength," they mean that ______A. the ratio of the price of the stock to a market index has trended upward.
B. the recent trading volume in the stock has exceeded the normal trading volume.
C. the total return on the stock has exceeded the total return on other stocks in the same industry.
D. the stock has performed well compared to other stocks in the same risk category as measured by beta.Correct Answer: A
Practice Question 21
Most technical analysts employ ______.A. only one trading rule
B. at most, two trading rules
C. a consensus of several trading rulesCorrect Answer: C
Since single rules do not work well in all situations and often break down, technical analysts typically look at several rules and employ a consensus.
Practice Question 22
A golden cross is ______.A. when a short-term moving average crosses from above a longer-term moving average
B. when a short-term moving average crosses from below a longer-term moving average
C. when a price line crosses from above a moving averageCorrect Answer: B
This movement is considered bullish.
Practice Question 23
When the average loss is zero, RSI becomes ______.A. zero
B. 50
C. 100Correct Answer: C
A "divide by zero" situation occurs for RS and RSI is set to 100 by definition. Assuming a 14-period RSI, this means that prices moved higher or remained the same all 14 periods. There were no losses to measure.
Practice Question 24
An arms index of 100 means the market is in ______.A. a selling mood
B. balance
C. a buying moodCorrect Answer: A
A value above 1 means that most trading activity is in declining stocks.
Practice Question 25
If a 20-day moving average is crossing from above a 60-day moving average, the movement is known as a ______.A. dead cross
B. good cross
C. golden crossCorrect Answer: A
When a short-term moving average crosses from above a longer-term moving average, it is called a dead cross.
Practice Question 26
Which factor has the least impact on a RSI's sensitivity?A. The selection of the time period
B. The volatility of the security itself
C. The current price trend of the securityCorrect Answer: C
The shorter the time period, the more sensitive the RSI becomes. The more volatile the security, the more sensitive the RSI becomes.
Practice Question 27
Typically, an RSI is considered oversold if it is ______.A. below 30
B. above 70
C. between 30 to 70Correct Answer: A
RSI is considered overbought if it is above 70 and oversold if it is below 30.
Practice Question 28
Based on traditional measures, a security is overbought if ______A. its stochastic oscillator is 85.
B. its RSI is 25.
C. its momentum oscillator is 90.Correct Answer: A
The stochastic oscillator measures the level of the close relative to the high-low range over a given period of time. Traditional settings use 80 as the overbought threshold.
Practice Question 29
Which technical indictor brings together momentum and trend?A. A relative strength index
B. A stochastic oscillator
C. A MACDCorrect Answer: C
By comparing EMAs of different periods, the MACD line illustrates changes in the trend of a security. By comparing that difference to an average, an analyst can chart subtle shifts in the stock's trend. Therefore, MACD brings together momentum and trend in one indicator.
Practice Question 30
Assume Google has a short interest of 75 million shares, while the average daily volume of shares traded is 70 million. Its current price is $450 and its average price over the last 30 days is $400. Google's short interest ratio is ______.A. 1.07 days
B. 1.125 days
C. 1.52 daysCorrect Answer: A
75,000,000/70,000,000 = 1.07 days. This means it would take 1.07 days for all of the short sellers to cover their positions.
Practice Question 31
The closing price today for a security was $20. It was $18 twenty days ago.A. This is a buy signal, based on the ROC oscillator.
B. This is a sell signal, based on the ROC oscillator.
C. No decision can be made without considering the general trend first.Correct Answer: C
Like all technical indicators, the rate-of-change oscillator should be used in conjunction with other aspects of technical analysis.
Practice Question 32
Margin loans may increase the purchase of stocks. Declining margin debt may force the selling of stocks. This is using margin debt as a ______.A. sentiment indicator
B. momentum indicator
C. flow-of-funds indicatorCorrect Answer: C
Margin debt can also be used as a sentiment indicator.
Practice Question 33
Which statement is false?A. When prices rise but RoC falls, a top is likely near.
B. A dead cross is considered bullish.
C. No matter how fast a security advances or declines, the stochastic oscillator will always fluctuate between 0 and 100.Correct Answer: B
A: This is an important signal to look for when locking in your profits from long positions as a bearish divergence may occur soon.
B: A dead cross is a bearish sign.
Practice Question 34
Which statement is false?A. Generally speaking, a 60-day moving average should be smoother than a 20-day moving average.
B. MACD is all about the convergence and divergence of the two moving averages.
C. The put/call ratio is normally above 1.0 but below 10.0.Correct Answer: C
The put/call ratio is normally below 1.0.
Practice Question 35
Technical analysts believe that speculative trading peaks at market ______.A. mid-points
B. troughs
C. peaks Correct Answer: C
Technicians consider speculative activity high when the ratio of OTC volume to NYSE volume on the NASDAQ system gets to 90 percent or more. Speculative trading typically peaks at market peaks.
Practice Question 36
Which of the following is most likely to be considered a momentum indicator?A. A mutual fund cash position
B. A put/call ratio
C. Breadth of marketCorrect Answer: C
Breadth of market is a momentum indicator. The put/call ratio and mutual fund cash position are contrary-opinion rules.

Study notes from a previous year's CFA exam:
5. Technical Indicators