- CFA Exams
- 2017 Level I > Study Session 4. Economics > Priliminary Reading 2. Demand and Supply Analysis: Consumer Demand
- 4. Consumer Equilibrium: Maximizing Utility Subject to the Budget Constraint
Why should I choose AnalystNotes?
Simply put: AnalystNotes offers the best value and the best product available to help you pass your exams.
Subject 4. Consumer Equilibrium: Maximizing Utility Subject to the Budget Constraint
The budget constraint line separates consumption bundles that are attainable from those that are unattainable. A consumer will maximise utility by consuming on the highest possible indifference curve (i.e., we assume all income is spent). This is where an indifference curve is tangent to the highest possible budget line.
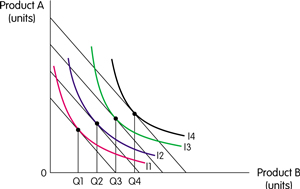
A consumer could consume at G, for example, but would be on a higher indifference curve at H. This means that to maximise utility the consumer would consume Q1 of product A and Q2 of product B.
The consumer is maximising utility where the budget line and indifference curve are tangent, i.e., MUB/MUA = PB/PA.
An Increase in Income
An increase in income shifts the budget line out parallel. The new combinations of products that maximise utility can be identified.
If this is a normal good, an increase in income increases the quantity demanded.
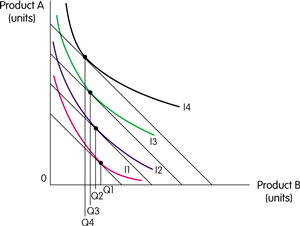
Inferior goods have a negative income elasticity of demand. Demand falls as income rises.
Practice Question 1
The slope of a budget constraint with combinations of cookies which cost $1 a cookie and milk which costs 0.50 a carton with cookies on the y-axis and milk on the x-axis is ______.A. 0.5
B. 2
C. -0.5Correct Answer: C
The slope of a budget constraint is -(the price of the good on the x-axis divided by the price of the good on the y-axis).
Practice Question 2
Refer to the graph below. A consumer would be expected to change consumption from point A to point B in response to ______.
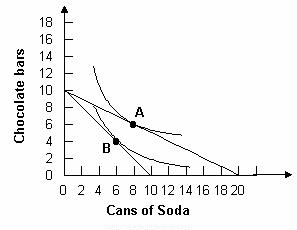
A. an increase in the price of soda
B. an increase in the price of chocolate bars
C. an increase in incomeCorrect Answer: A
Only an increase in the price of soda could have caused the budget line to shift as shown in the graph.
Practice Question 3
In indifference curve analysis, when the price of one of the goods under consideration decreases, ______A. the slope of the budget-constraint line will change.
B. the indifference curves will shift.
C. the individual's real income will decrease.Correct Answer: A
The slope of the budget constraint is the relative price ratio between the two goods represented on the axes. Thus, if one of the prices changes, the slope of the budget constraint will also change. If the price of good x increases, the slope of the budget constraint increases. If the price of good x decreases, the slope of the budget constraint decreases.
Practice Question 4
The following figure shows Bobby's indifference map for juice and snacks. Also shown are three budget lines resulting from different prices for snacks. Bobby's demand for snacks is ______.
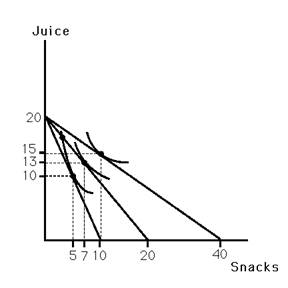
A. unit elastic
B. elastic
C. inelasticCorrect Answer: C
Practice Question 5
As the price of a good rises, the consumer will experience ______.I. a desire to consume a different bundle
II. a decrease in utility
III. a southwesterly movement on the indifference mapCorrect Answer: I, II and III
Practice Question 6
If a person supplies fewer hours of labor in response to a wage increase, then ______A. the substitution effect is greater than the income effect.
B. the income effect is greater than the substitution effect.
C. the person is not maximizing utility.Correct Answer: B
Practice Question 7
Refer to the graph below. Assuming a consumer has $5 to spend, if a soda costs $0.50 and a chocolate bar costs $0.50, the consumer would optimally choose to consume ______.
A. at point A
B. at point B
C. 10 cans of soda and 0 chocolate barsCorrect Answer: B
With $5, the maximum number of chocolate bars or cans of soda that can be bought are 10 and 10 respectively. To maximize utility, find where the maximum utility curve is tangent to this income constraint.
Practice Question 8
The following figure shows Bobby's indifference map for soda and juice. B1 indicates his original budget line. B2 indicates his budget line resulting from an increase in the price of soda. From the graph, one can conclude that ______
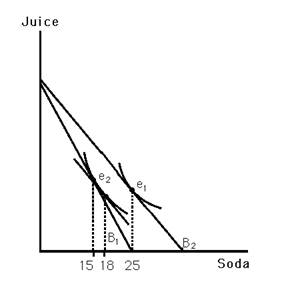
A. Bobby views soda as an inferior good.
B. Bobby views soda as a normal good.
C. the income elasticity of demand for soda is 1.Correct Answer: B
Bobby will consume more soda if his income increases.

Study notes from a previous year's CFA exam:
4. Consumer Equilibrium: Maximizing Utility Subject to the Budget Constraint