- CFA Exams
- 2017 Level I > Study Session 4. Economics > Priliminary Reading 1. Demand and Supply Analysis: Introduction
- 2. Basic Principles and Concepts
Why should I choose AnalystNotes?
AnalystNotes specializes in helping candidates pass. Period.
Subject 2. Basic Principles and Concepts
The demand function represents buyers' behavior.

Prices influence consumers' purchase decisions. The demand function can be depicted as a negatively sloped demand curve.
- If all other factors are equal, as the price of a good rises, consumer demand falls. This is mainly due to the availability of substitutes, which are goods that perform similar functions.
- As the price of a good falls, consumer demand rises.
Therefore, there is an inverse relationship between the price of a good and the amount that consumers are willing to buy. The demand curve normally slopes downward. It tells the analyst the quantity that consumers are willing to buy for each possible price when all other influences on consumers' planned purchases remain the same.
Example 1
Refer to the graph below. What is the quantity of cassettes demanded when their price is $4.00 per week?
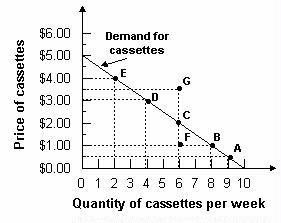
Answer: Two cassettes per week. The demand curve tells how much is demanded at each price. To determine the quantity demanded, find $4.00 on the vertical axis and read across until you meet the demand curve. Then read the quantity from the horizontal axis.
When any factor that influences buying plans, other than the price of the good, changes, there is a change in demand for that good. When the quantity of the good that people plan to buy changes at each and every price, there is a new demand curve. These factors include changes in income, number of consumers in the market, changes in the price of a related good, etc.
Example 2
Assume the graph below reflects demand in the automobile market. Which arrow best captures the impact of increased consumer income on the automobile market?
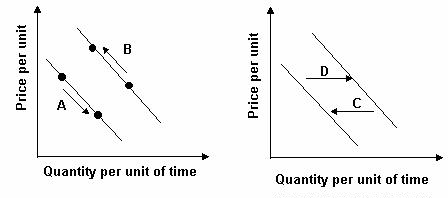
Answer: D. Income is a shift factor of demand. An increase in income increases the number of automobiles demanded at each price. Therefore demand has shifted to the right.
- When demand increases, the quantity that people plan to buy increases at each and every price, so the demand curve shifts rightward.
- When demand decreases, the quantity that people plan to buy decreases at each and every price, so the demand curve shifts leftward.
A Change in the Quantity Demanded Versus a Change in Demand
The demand curve isolates the impact of price on the amount of a product purchased.
- A change in quantity demanded (caused by price change ONLY) is a movement along a demand curve from one point to another.
- Changes in other factors (anything other than price), such as income, tastes, expectations, and the prices of closely related goods, will shift the entire demand curve inwards or outwards. This is referred to as change in demand.
Example 3
Refer to the graph below. Consumers began purchasing more of a product due to a decrease in price. Which arrow best represents this statement?
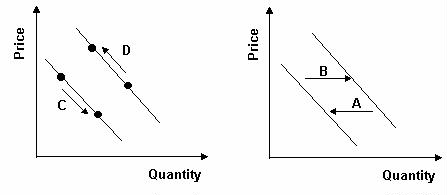
Answer: C. A change in price causes a movement along the demand curve. When price falls, the movement is downward and to the right.
The Supply Function and the Supply Curve
Resources and technology determine what it is possible to produce. Supply reflects a decision about which technologically feasible items are best to produce. The supply function represents sellers' behavior.

Prices influence producers' supply decisions. The supply function can be depicted as a positively sloped supply curve.
- If all other factors are equal, a higher price will increase the producer's incentive to supply the good. Higher prices increase the producer's profit, which is the excess of sales revenue over the cost of production.
- As the price of a good falls, its supply falls as well.
Therefore, there is a direct relationship between the price of a good and the amount of that good that will be supplied. The supply curve slopes upward. It tells the analyst the quantity that producers are willing to supply for each price when all other influences on producers' planned sales remain the same.
Example 4
The graph below displays the quantity associated with price in a supply table.
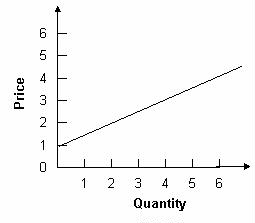
To find the quantity supplied at a price of $1, extend a horizontal line from $1 to the supply curve and drop a vertical line down to the quantity axis. These lines will intersect at 0. This is the quantity that will be associated with a price of $1 on a supply table.
The law of supply results from the general tendency for the marginal cost of producing a good or service to increase as the quantity produced increases.
A supply curve is also a minimum-supply-price curve. The greater the quantity produced, the higher the price a firm must be offered to be willing to produce that quantity.
A Change in Supply
Changes in other factors will influence the amount of products that producers are willing to supply. These factors include the prices of productive resources, expected future prices, number of suppliers, taxes, etc.
These factors affect the opportunity cost of supplying a good, and are held constant when drawing a supply curve. Changes in these factors will shift the entire supply curve for the good.
Example 5
Refer to the graph below. A shift from S1 to S0 would most likely occur for what reason?
A. An increase in the number of suppliers in the market
B. A decrease in taxes levied on the good produced in the market
C. An increase in the price of the good produced in the market
D. An increase in the cost of producing this good
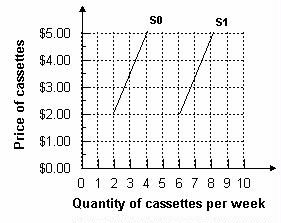
Answer: D. An increase in the cost of producing the good causes supply to shift leftward. An increase in the number of firms and a decrease in taxes cause supply to shift rightward. A change in price causes a movement along supply, not a shift.
A Change in the Quantity Supplied Versus a Change in Supply
The quantity supplied of a good or service is the amount that producers plan to sell during a given time period at a particular price.
Price is just one of the factors that affect producers' supply decisions. The supply curve isolates the impact of price on the quantity of a product supplied and assumes that all other factors stay the same.
- A change in quantity supplied is caused by a price change ONLY. It is a movement along the same supply curve.
- When one of the other factors that influence selling plans changes, there is a change in supply and a shift of the supply curve.
Example 6
A tax will shift the supply curve up by the amount of the tax.
At every price level, less is supplied. For example, at price P0, originally Q0 is supplied. After the tax, Q1 is supplied at price P0.
Practice Question 1
As the price of pizza increases, the ______ declines.A. quantity of pizza demanded
B. demand for pizzaCorrect Answer: A
Practice Question 2
The price of electricity is cheaper in the northwestern part of the United States and therefore the ______ is greater in the northwest.A. demand for electricity
B. quantity of electricity demandedCorrect Answer: B
Practice Question 3
When an economist says that the demand for a product has increased, this means that ______A. consumers are now willing to purchase more of this product at each possible price.
B. product price has fallen and as a consequence consumers are buying a larger quantity of the product.
C. the demand curve has shifted to the left.Correct Answer: A
Practice Question 4
An increase in the incomes of car buyers will increase the ______.A. quantity of cars demanded
B. demand for carsCorrect Answer: B
Practice Question 5
An increase in the ______ means consumers are willing and able to buy more lobsters at any given price (whatever the current price is).A. quantity of lobsters demanded
B. demand for lobstersCorrect Answer: B
Practice Question 6
Which statement is not consistent with the law of supply?A. The more of a good that will be supplied, the higher the price, other factors remaining constant.
B. The less of a good that will be supplied, the lower the price, other factors remaining constant.
C. The quantity supplied of a good is directly related to the good's price.
D. The quantity supplied of a good is inversely related to the good's price.Correct Answer: D
The law of supply states that if other factors remain equal as the price of a good goes up, the quantity supplied goes up; as the price of a good goes down, the quantity supplied goes down. Price and quantity supplied are directly related.
Practice Question 7
According to the law of supply, ______I. supply curves slope upward.
II. supply curves slope downward.
III. price and quantity supplied are negatively related.
IV. price and quantity supplied are inversely related.Correct Answer: I
The law of supply states that if other factors are equal as the price of a good goes up, the quantity supplied goes up; as the price of a good goes down, the quantity supplied goes down. This is shown graphically by a curve that slopes upward.
Practice Question 8
Whenever the price of bicycles increases, the ______ increases.A. quantity of bicycles supplied
B. quantity of bicycles demandedCorrect Answer: A
Practice Question 9
If the price of cheese increases, there will be ______ of pizza.A. a decrease in the supply
B. an increase in the quantity supplied
C. an increase in the supplyCorrect Answer: A
Cheese is an input in the production of pizzas. An increase in the price of an input will decrease the supply (leftward shift of the supply curve) of pizzas.
Practice Question 10
A ______ means suppliers will provide fewer frog legs (whatever the current price is).A. decrease in the quantity of frog legs supplied
B. decrease in the supply of frog legsCorrect Answer: B
Practice Question 11
The law of demand states that, other factors remaining constant, there is ______.A. an inverse relation between price and demand
B. an inverse relation between price and the quantity demanded
C. a direct relation between price and demandCorrect Answer: B
The law of demand states that the more of a good demanded, the lower its price (other factors remaining constant); the less of a good demanded, the higher its price (other factors remaining constant). That is, there is an inverse relationship between price and quantity demanded. The relationship is between quantities demanded, not demand.
Practice Question 12
The law of demand is simply a reflection of ______.A. a downward-sloping demand schedule
B. the direct relationship between consumer needs and the price of goods
C. the production possibilities curveCorrect Answer: A
The law of demand suggests that as the price of a good increases, demand for that good will fall; similarly, as the price of the good declines, demand for it will rise. This is reflected in the market demand schedule which has a negative slope when price is on the Y-axis and quantity is on the X-axis.
Practice Question 13
Which of the following factors is held constant when an economist constructs a demand schedule for a product?I. Prices of complements and substitutes
II. Expectations about the future price of the product
III. Consumer tastes and preferences
A. I and III
B. II and III
C. I, II and IIICorrect Answer: C
An economist constructing a demand curve is concerned only with how consumers react to varying prices of a good. Thus, the price of complementary or substitute goods is held constant, consumer tastes and preferences are held constant, and expectations of future prices are also held constant. The only varying element used in the construction of the schedule is price: the demand curve plots the level of demand associated with different prices of the good.
Practice Question 14
When economists say the demand for a product has increased, they mean that ______A. the amount of the product that consumers are willing to purchase at various prices has increased.
B. the price of the product has fallen and consequently consumers are buying more of the product.
C. the demand curve for the product has shifted to the left.Correct Answer: A
An increase in the demand for a product implies that at a given price, consumers are willing to buy more units. Suppose that at a price of $10 consumers demand 2 restaurant meals. An increase in the demand for restaurant meals implies that individuals now demand 4 restaurant meals at the price of $10/each.
Practice Question 15
If the price of a Wii game increases from $32 to $38 and, as a result, consumer purchases decrease, then there has been ______.A. a shift in the demand curve
B. a decrease in the quantity demanded
C. an increase in demandCorrect Answer: B
This is a movement along the demand curve: as price increases, individuals consume less at the higher price. There has been no shift in other factors and thus the demand schedule is constant.
Practice Question 16
If a major magazine contained a review of your restaurant saying it was the best in the Midwest, which of the following would most likely happen?A. Quantity demanded would increase.
B. Quantity demanded would drop.
C. Demand would increase.Correct Answer: C
Anything that affects demand other than price will result in a shift in demand. In this case, price has not changed. At each price, more of your restaurant services would be demanded; demand would increase.
Practice Question 17
An increase in price, if all other factors do not change, leads to a ______.A. shift outwards in demand
B. shift inwards in demand
C. contraction of demandCorrect Answer: C
This is a movement along the demand curve and leads to a fall in the quantity demanded.
Practice Question 18
The height of a supply curve reveals ______.A. the maximum price suppliers are willing to accept for a unit of a good
B. the opportunity cost of producing an additional unit of a good
C. the producer surplus associated with supplying an additional unit of a goodCorrect Answer: B
The height of the supply is determined by the opportunity cost of production and determines the minimum price suppliers are willing to accept for a unit of a good.
Practice Question 19
A change in the supply of soybeans could be due to which of the following?I. A decrease in the price of insecticide
II. Improved equipment for soybean harvesting
III. Highly favorable weather conditions
A. I, II and III
B. I and II
C. II and IIICorrect Answer: A
A decrease in the price of a resource used to produce a good, technological improvement, and favorable weather conditions are all possible causes of an increase in supply.
Practice Question 20
Which statement(s) is (are) true?I. The supply curve summarizes information about production conditions.
II. The supply curve indicates the quantity of a good that producers would be willing to supply at different prices.
A. I only
B. II only
C. I and IICorrect Answer: C
The supply curve indicates both the minimum price necessary to induce producers to supply a specific quantity and the opportunity cost of producing the marginal unit of the good.
Practice Question 21
You are using a supply and demand diagram to study the market for oranges. What impact would a decrease in the price of oil burned to keep oranges from freezing in the winter have on the market?A. It would shift the supply curve for oranges to the right and the demand curve to the left.
B. It would shift the supply curve for oranges to the left and the demand curve to the left.
C. It would shift the supply curve for oranges to the right.Correct Answer: C
A decline in the price of an input used in the production of oranges will shift the supply curve for oranges to the right. This is because the opportunity cost of producing oranges has decreased.

Study notes from a previous year's CFA exam:
2. Basic Principles and Concepts